Test Statistics
Every test result from every build, in one place
When Encore Cloud builds your application, it runs your tests and records the result of every test case. The Tests page in the Cloud Dashboard turns those results into answers: what is failing right now, which tests are flaky, where the time in your test suite goes, and which commit made a test slower.
Encore.go applications report their test results automatically. Encore.ts applications publish them by writing a JUnit XML report, which takes a few lines of test runner configuration. See Publishing test results.
Encore Cloud can also record which lines of your code the tests run. See Test Coverage.
Publishing test results
Every build runs your tests as part of its build & test phase, and Encore Cloud reads the results from JUnit XML reports.
Encore.go
Encore.go applications report test results automatically. There is nothing to configure.
Encore runs your tests with go test -json and turns the results into a report. The build log still shows the usual go test -v output.
Encore.ts
In Encore.ts, the tests run with the test script in your package.json, so your test runner decides what gets reported. When the tests run in Encore Cloud, the ENCORE_TEST_REPORT_DIR environment variable is set to a directory. Configure your test runner to write a JUnit XML report into it. Encore Cloud reads every .xml file in that directory and in its immediate subdirectories.
Vitest
With Vitest, turn on the built-in junit reporter when ENCORE_TEST_REPORT_DIR is set. Starting from the vite.config.ts in the testing guide, add a test section:
vite.config.ts/// <reference types="vitest" />
import { defineConfig } from "vite";
import path from "path";

// Set by Encore Cloud when it runs your tests; unset locally.
const reportDir = process.env.ENCORE_TEST_REPORT_DIR;

export default defineConfig({
  resolve: {
    alias: {
      "~encore": path.resolve(__dirname, "./encore.gen"),
    },
  },
  test: {
    // Publish a JUnit report to Encore Cloud, and keep the usual output in the build log.
    reporters: reportDir ? ["default", "junit"] : ["default"],
    outputFile: reportDir ? { junit: path.join(reportDir, "junit.xml") } : undefined,
  },
});
Running encore test locally is unaffected: the variable is not set there, so Vitest prints its usual output and writes no report.
Other test runners
Any test runner with a JUnit reporter works the same way: point its output at ENCORE_TEST_REPORT_DIR. For example, with Jest, add jest-junit as a reporter and set JEST_JUNIT_OUTPUT_DIR to the value of ENCORE_TEST_REPORT_DIR.
If a build writes no report, its run is still listed, as No report, together with whether the tests passed.
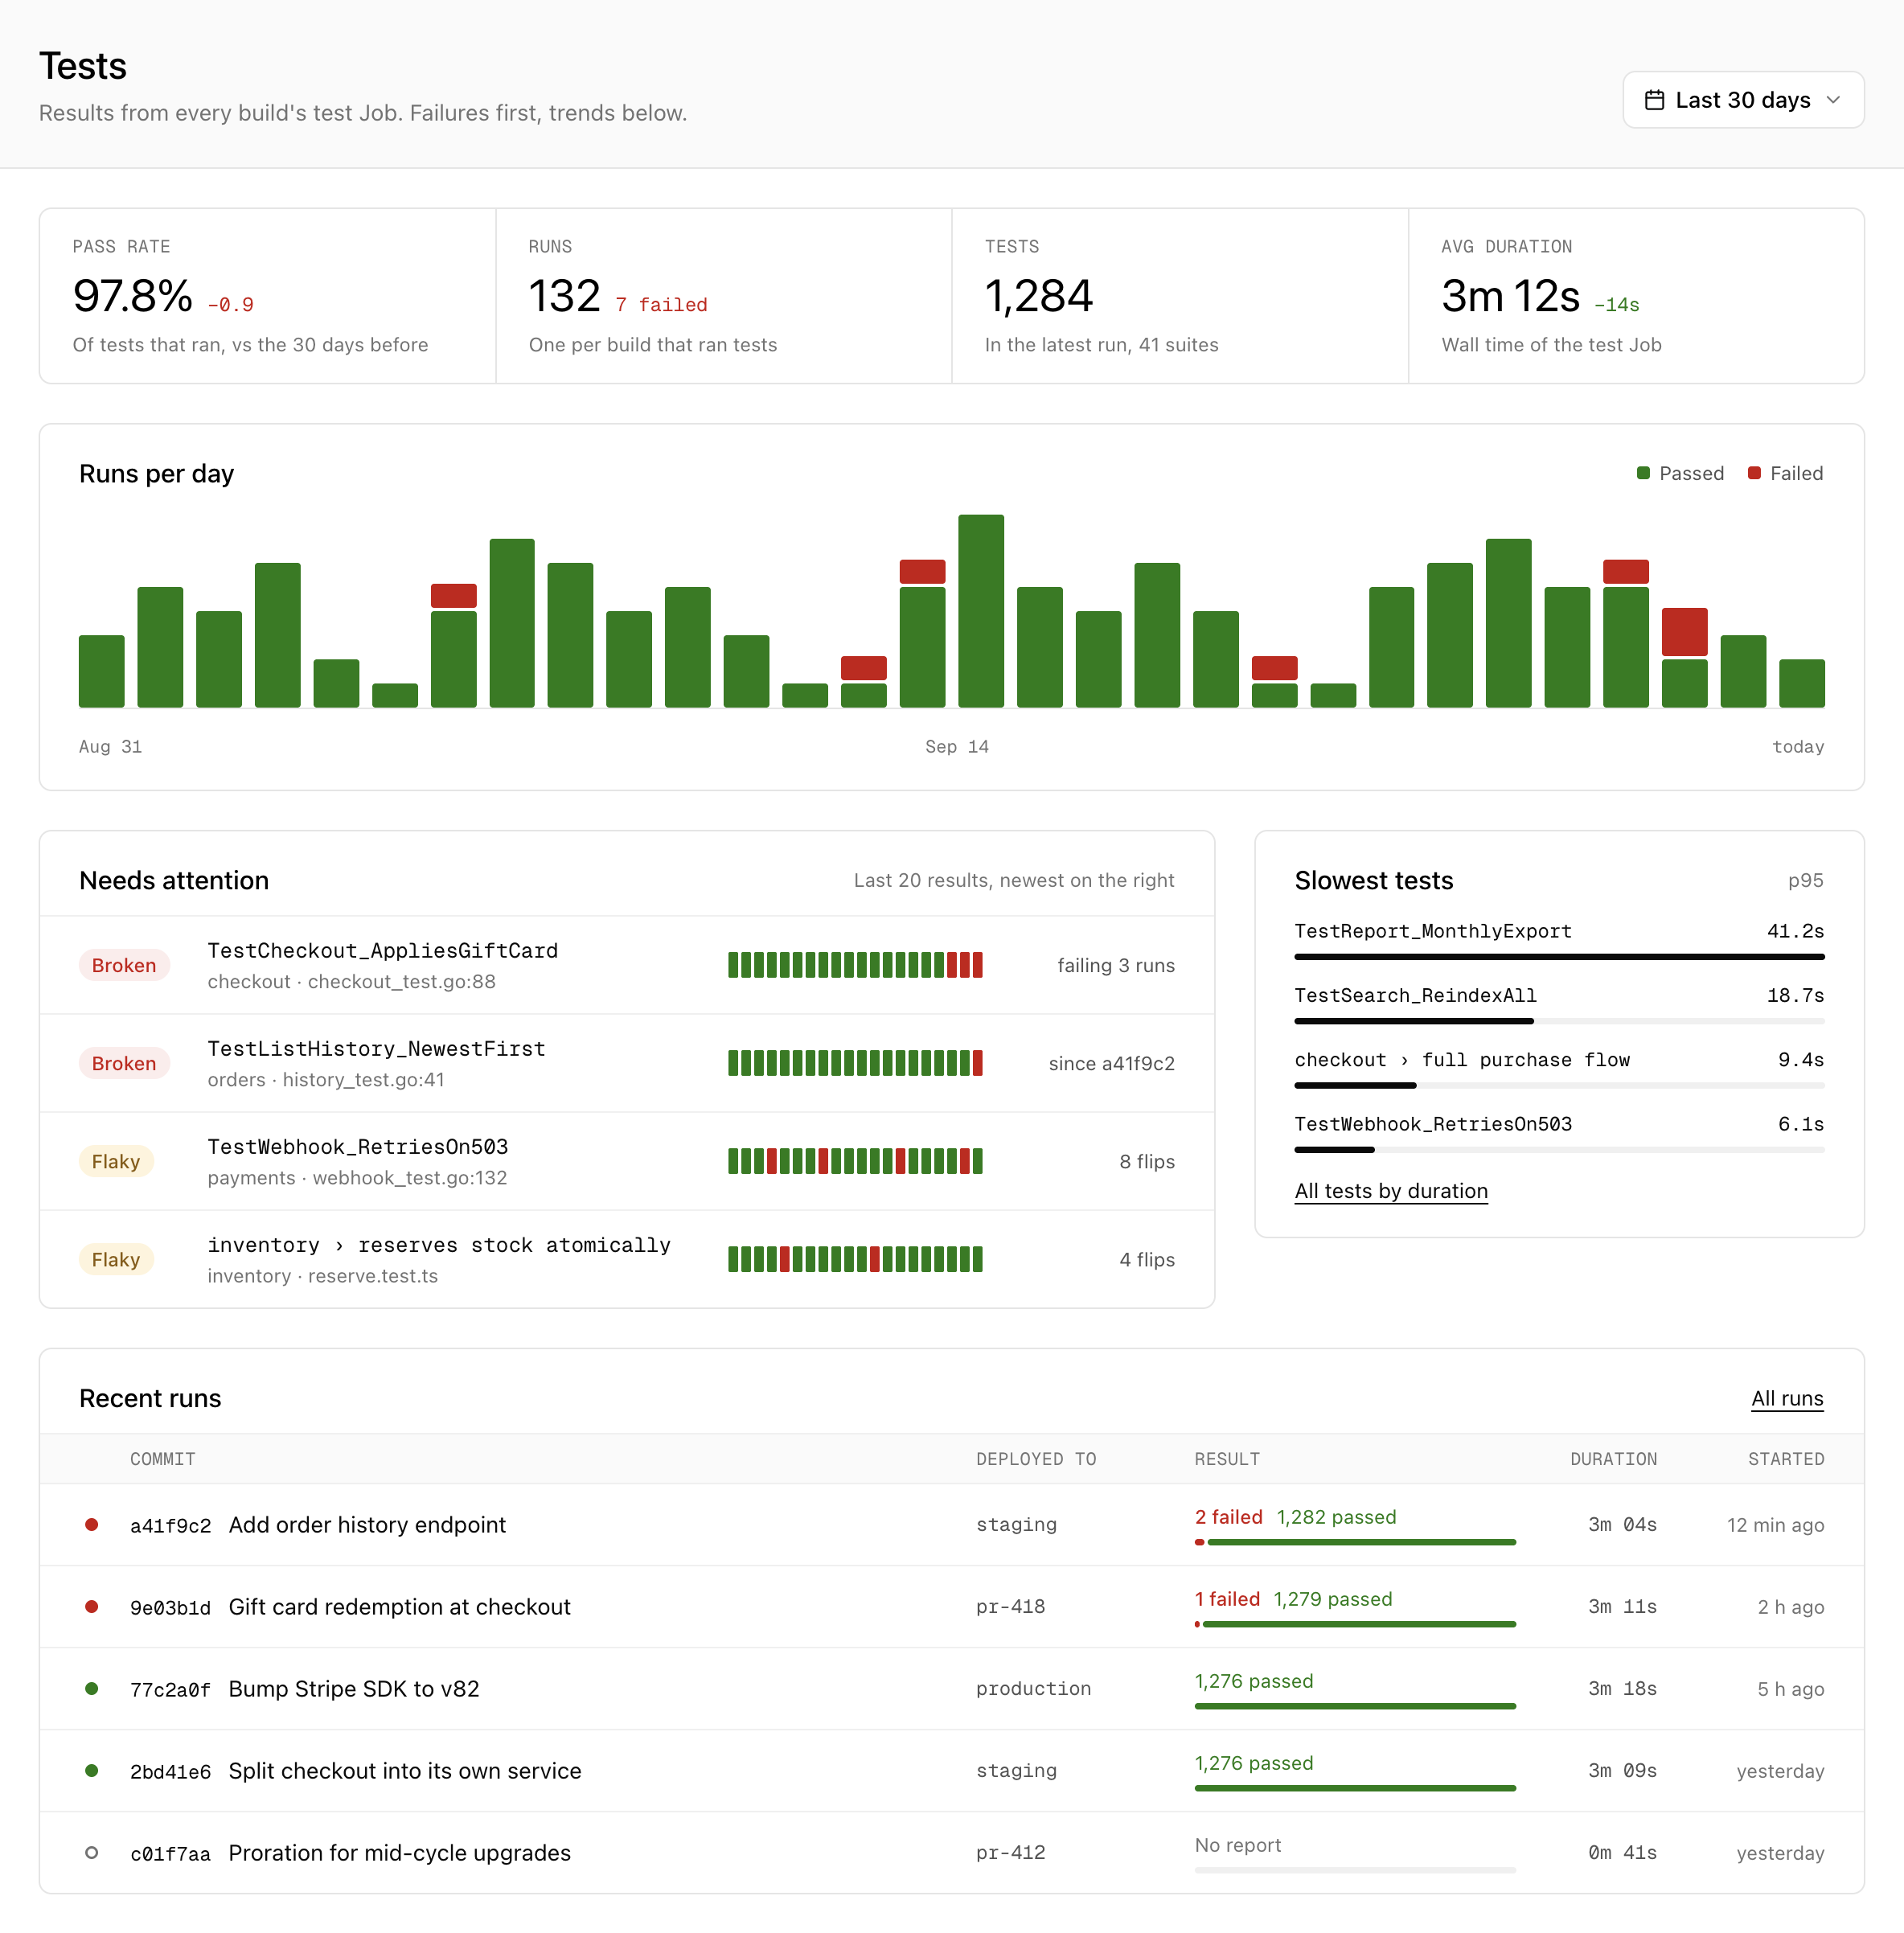
Tests overview
Open your app in the Cloud Dashboard and select Tests in the main navigation. The overview covers the last 7, 30 or 90 days:
- Pass rate, Runs, Tests and Avg duration, each compared with the period before. Skipped tests don't count toward the pass rate.
- Runs per day, split into passed and failed runs.
- Needs attention lists the tests to look at first, each with its last 20 results:
- Broken tests failed in their most recent run, after passing earlier in the period.
- Flaky tests both passed and failed during the period, and switched between the two at least twice.
- Slowest tests ranks tests by their 95th percentile duration.
- Recent runs lists the latest runs with their commit, the environments the build was deployed to, and the result.
Test runs
Every build that runs tests produces a test run. Open a run from Recent runs or from the test step of a deploy.
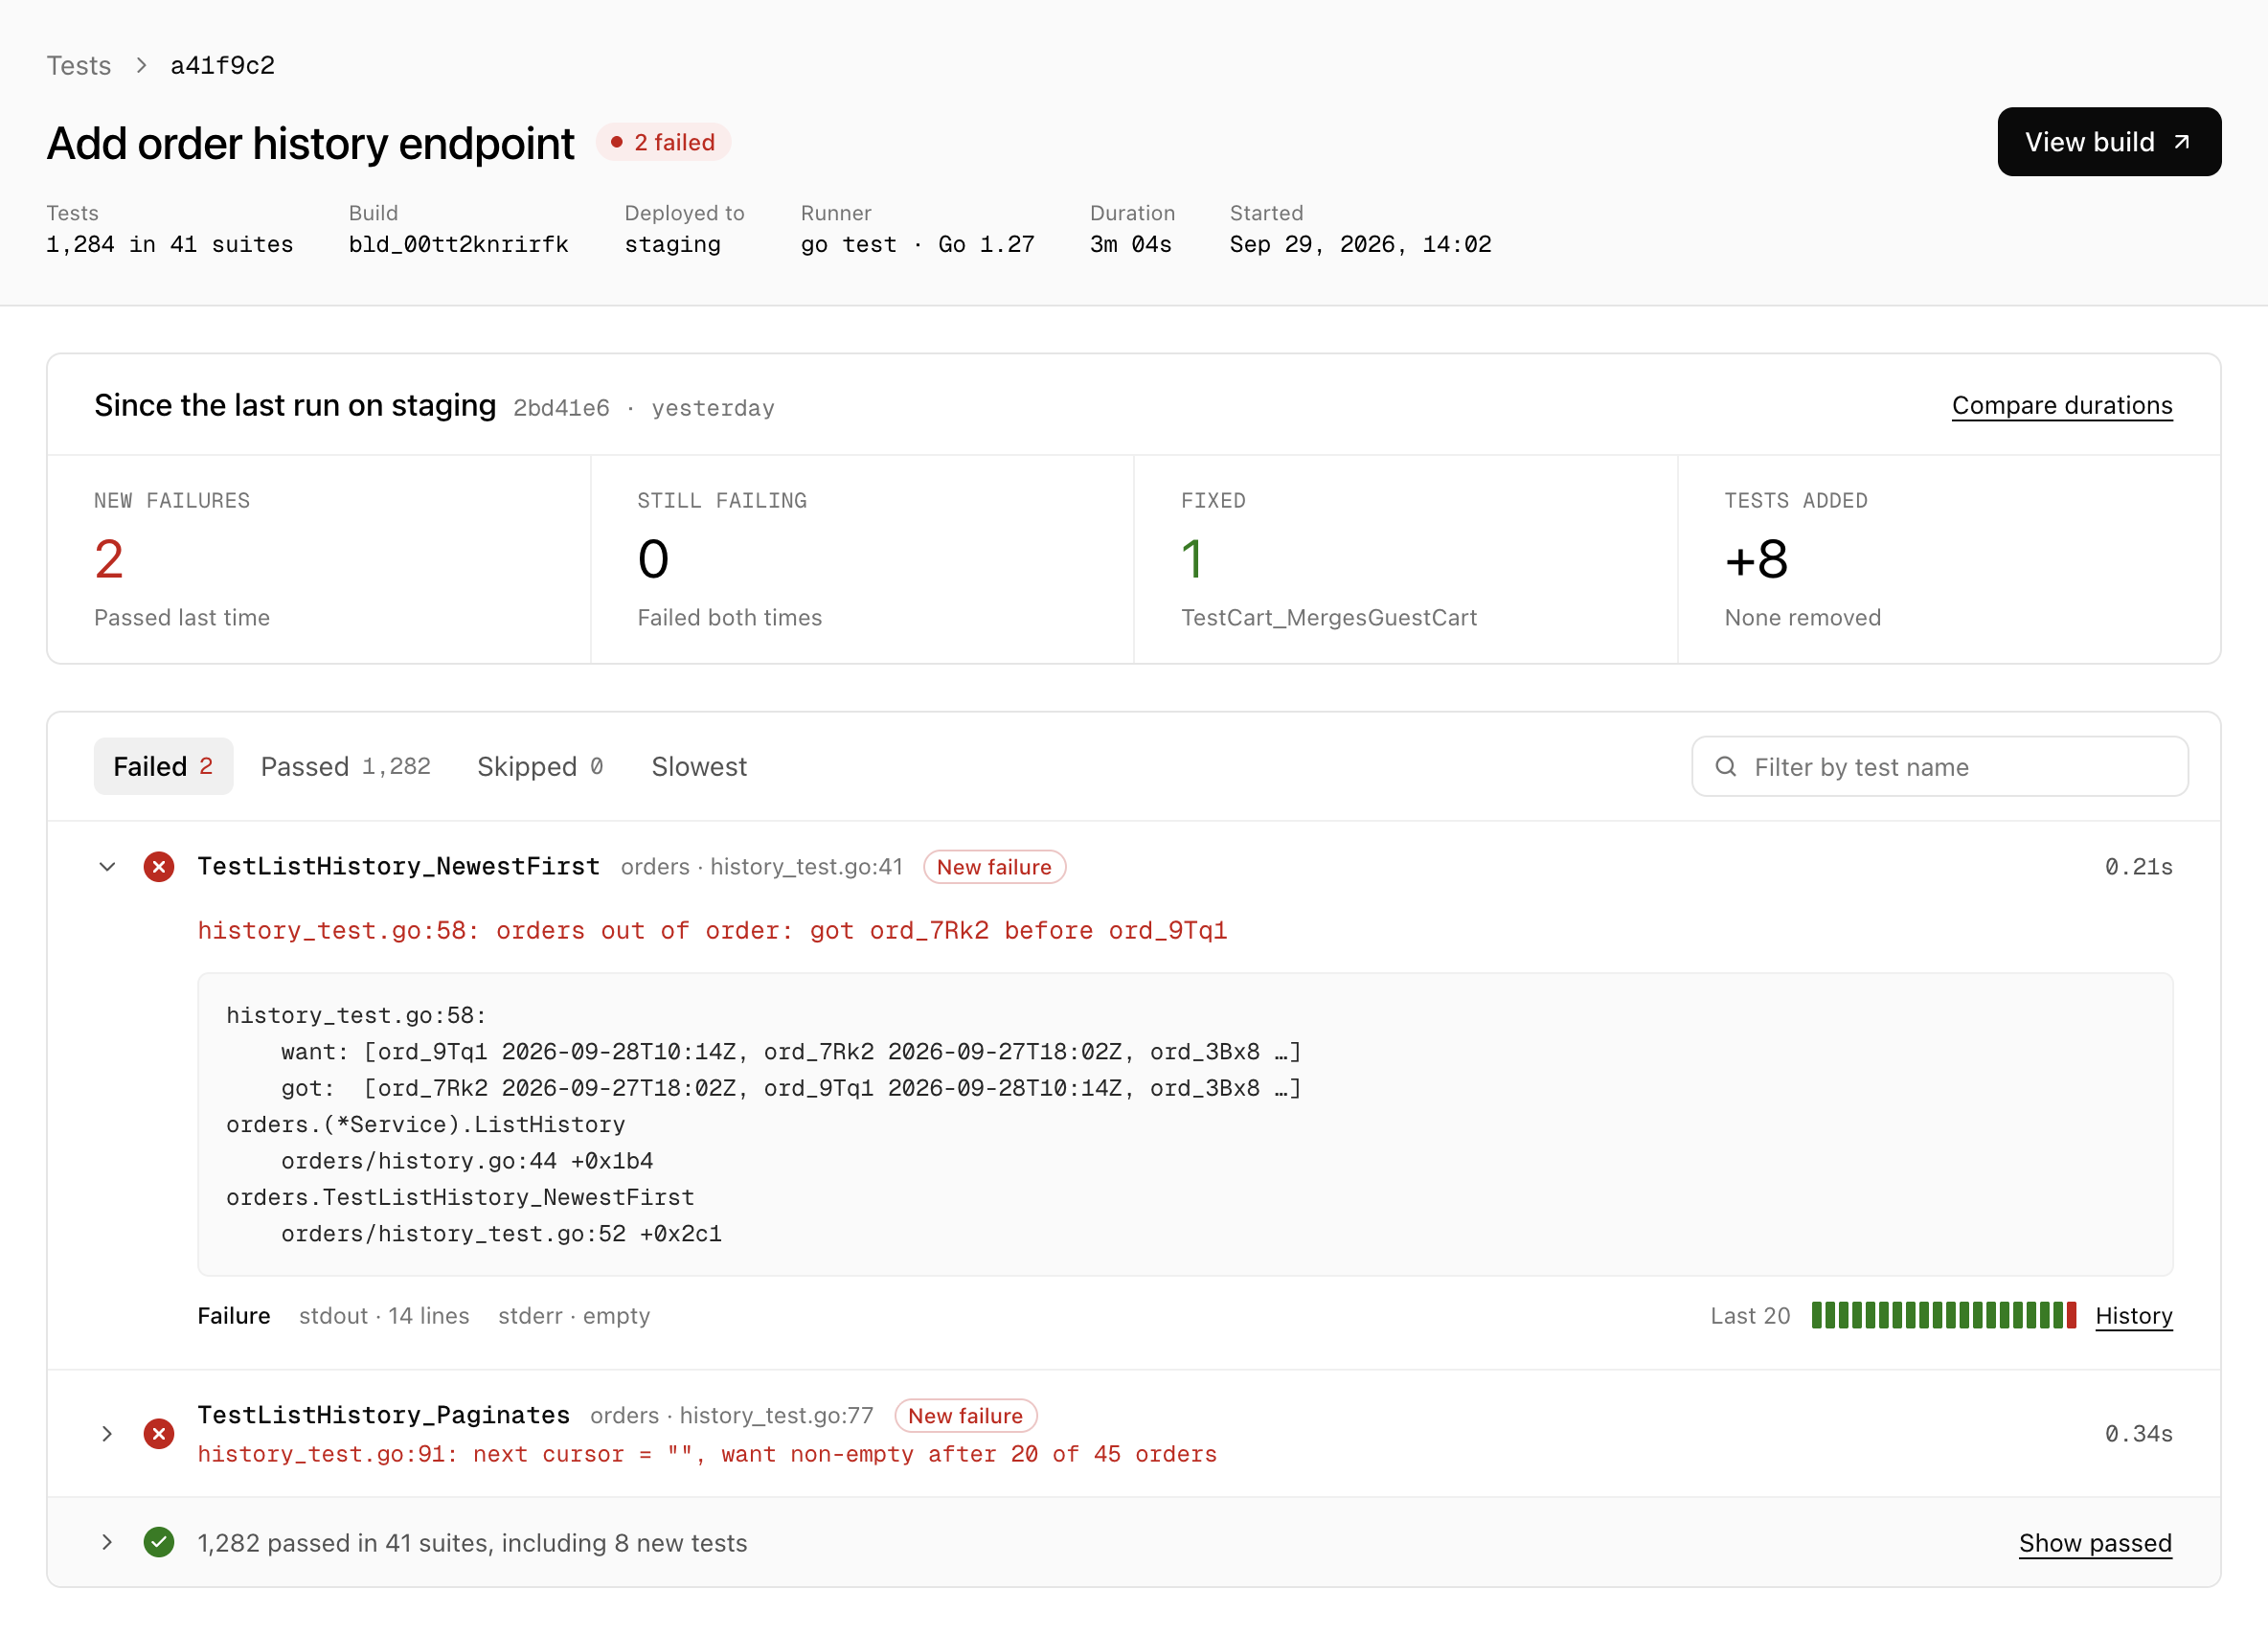
The run compares itself with an earlier run on the same branch or environment:
- New failures are tests that fail now but passed last time.
- Still failing are tests that failed in both runs.
- Fixed are tests that failed last time and pass now.
- Tests added counts tests that are new in this run, and how many were removed.
Compare durations opens the two runs in Compare runs.
When your app measures coverage, the run also shows its coverage, and its Coverage tab shows whether the lines the commit changed are tested. See Test Coverage.
Below the comparison, the run's tests are grouped into Failed, Passed, Skipped and Slowest, and you can filter them by test name. A failed test shows its failure message, and you can switch between the failure and the test's stdout and stderr. Output is kept for failed tests only. Each test also shows its last 20 results and links to its history.
In a deploy
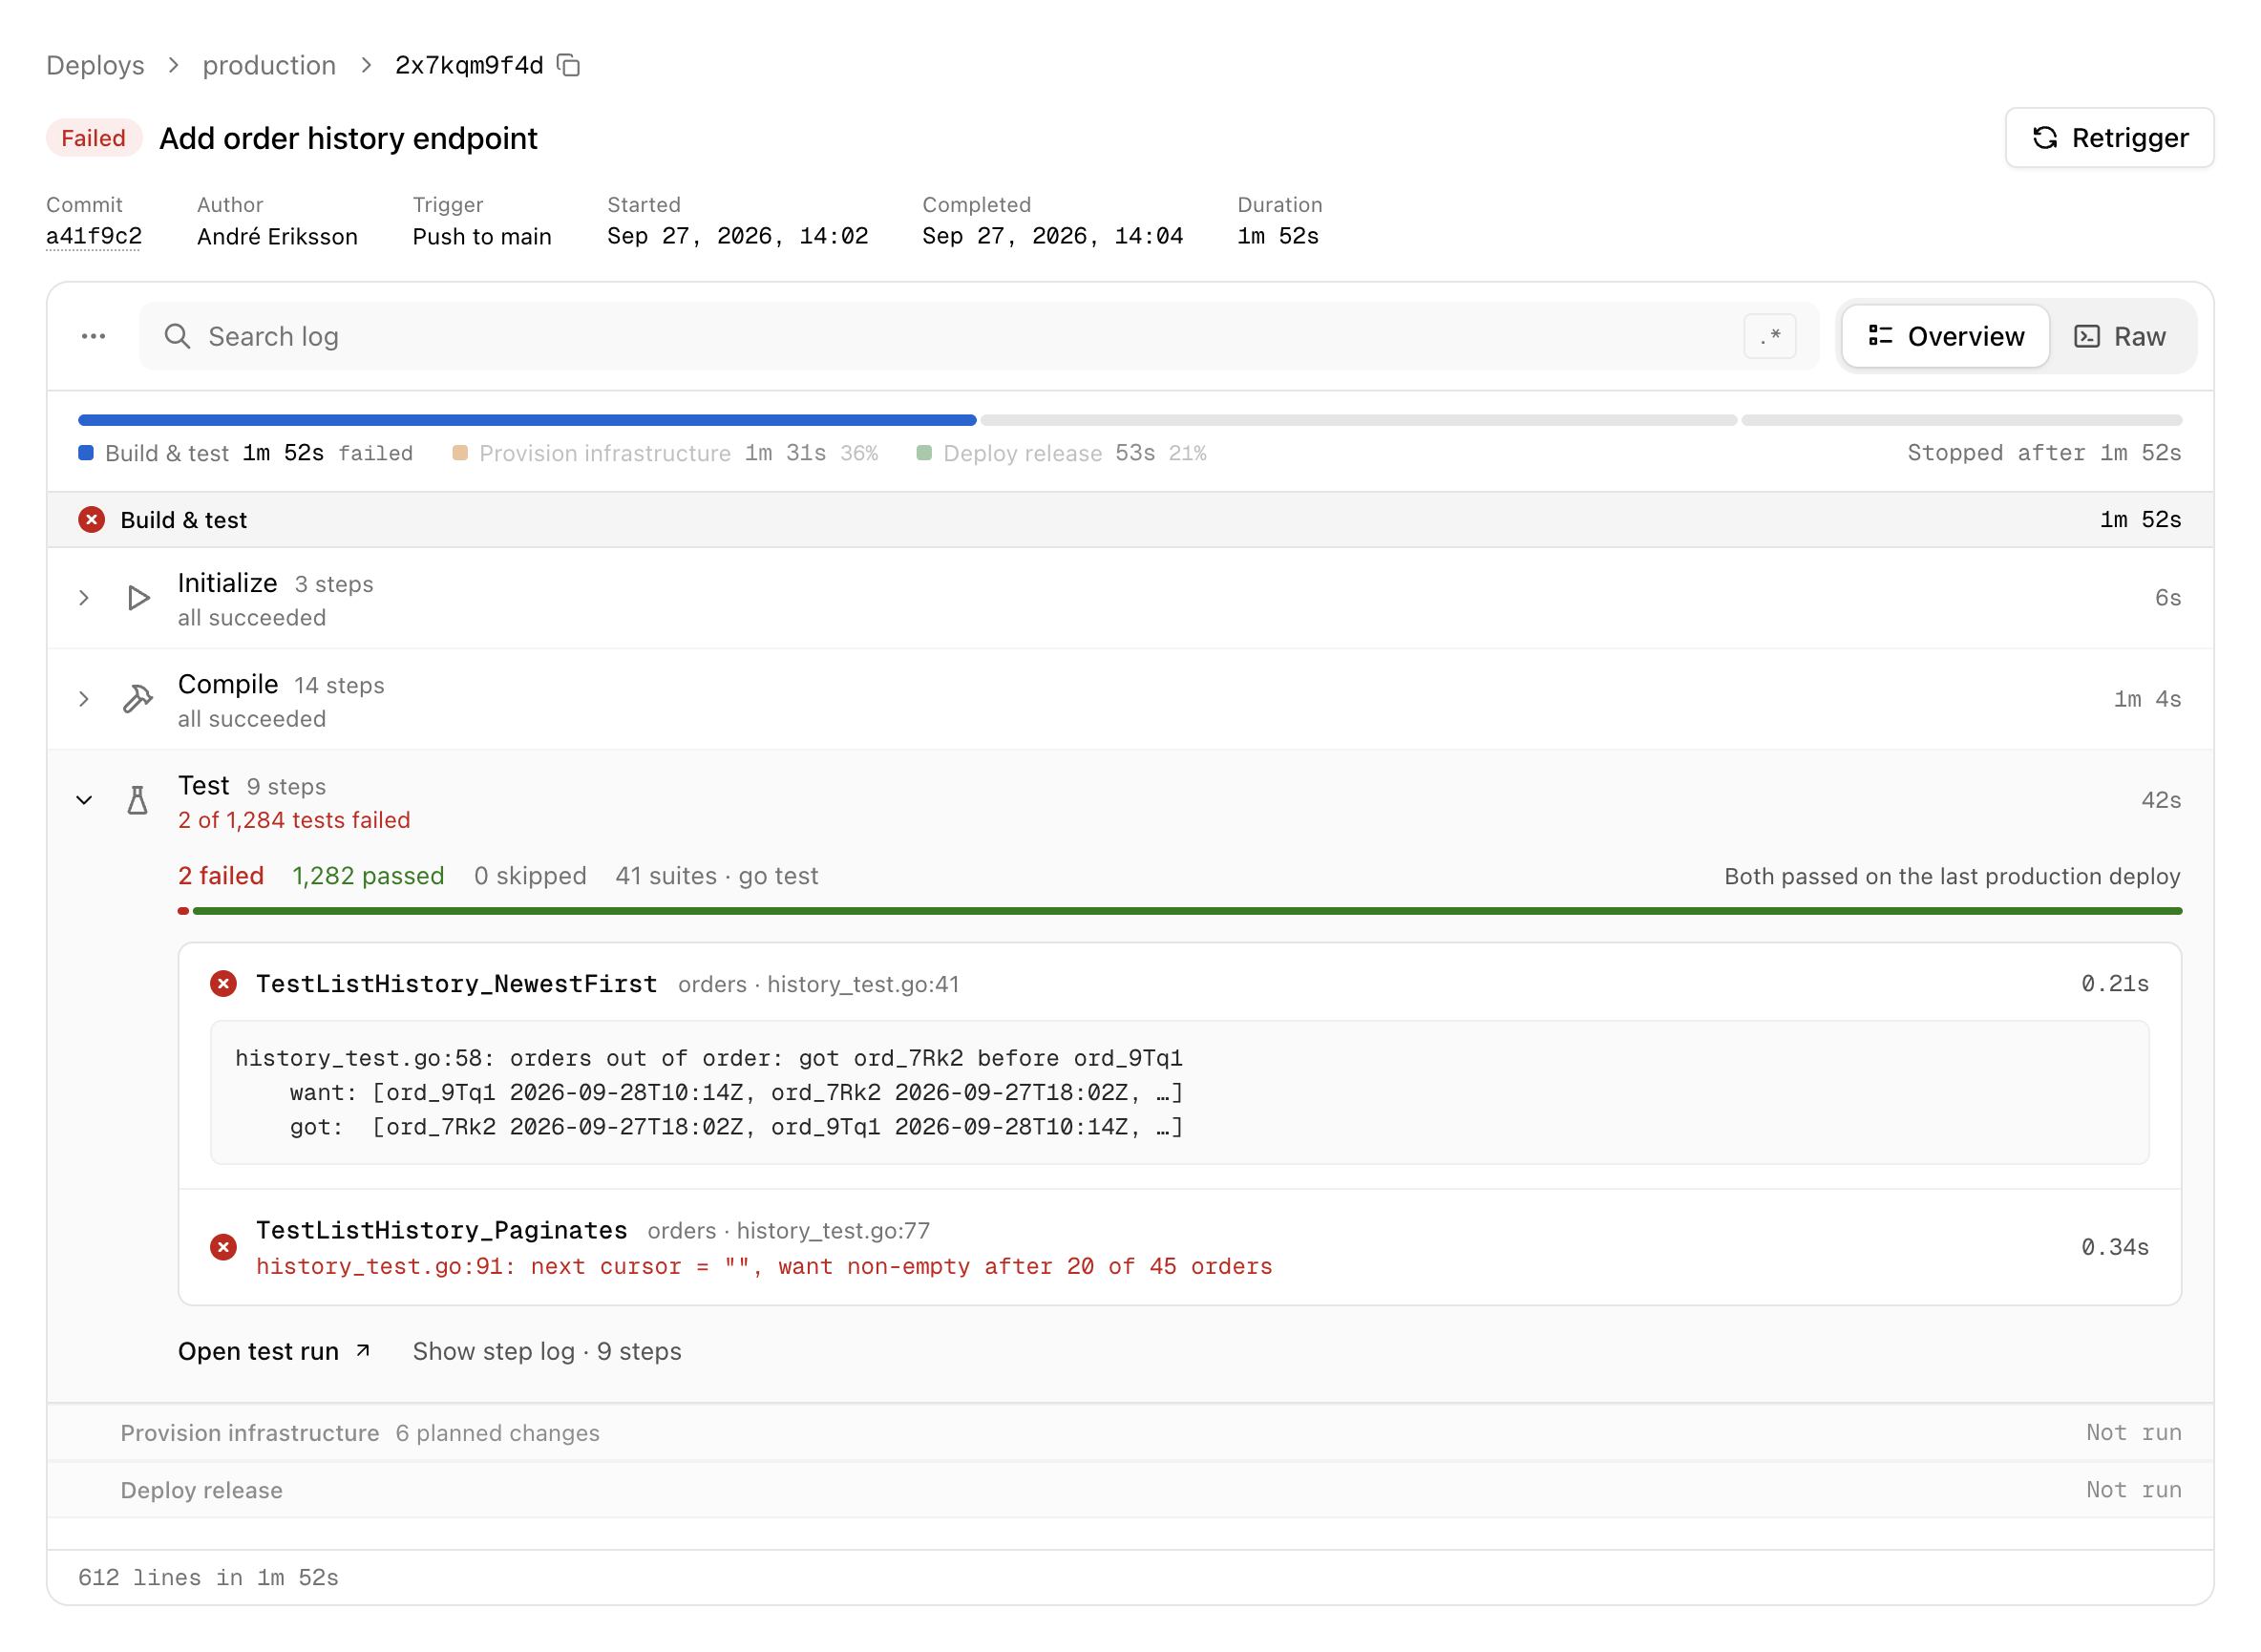
The deploy page shows the same results in its Test step: how many tests failed, passed and were skipped, the first failures with their output, and whether the failing tests passed on the previous run. Open test run takes you to the full run.
Test history
Select a test anywhere on the Tests pages to see its history over the last 30 days: how often it ran, its failure rate, its median (p50) and 95th percentile (p95) duration, and when it last failed. A test is marked Flaky or Failing when it is one.
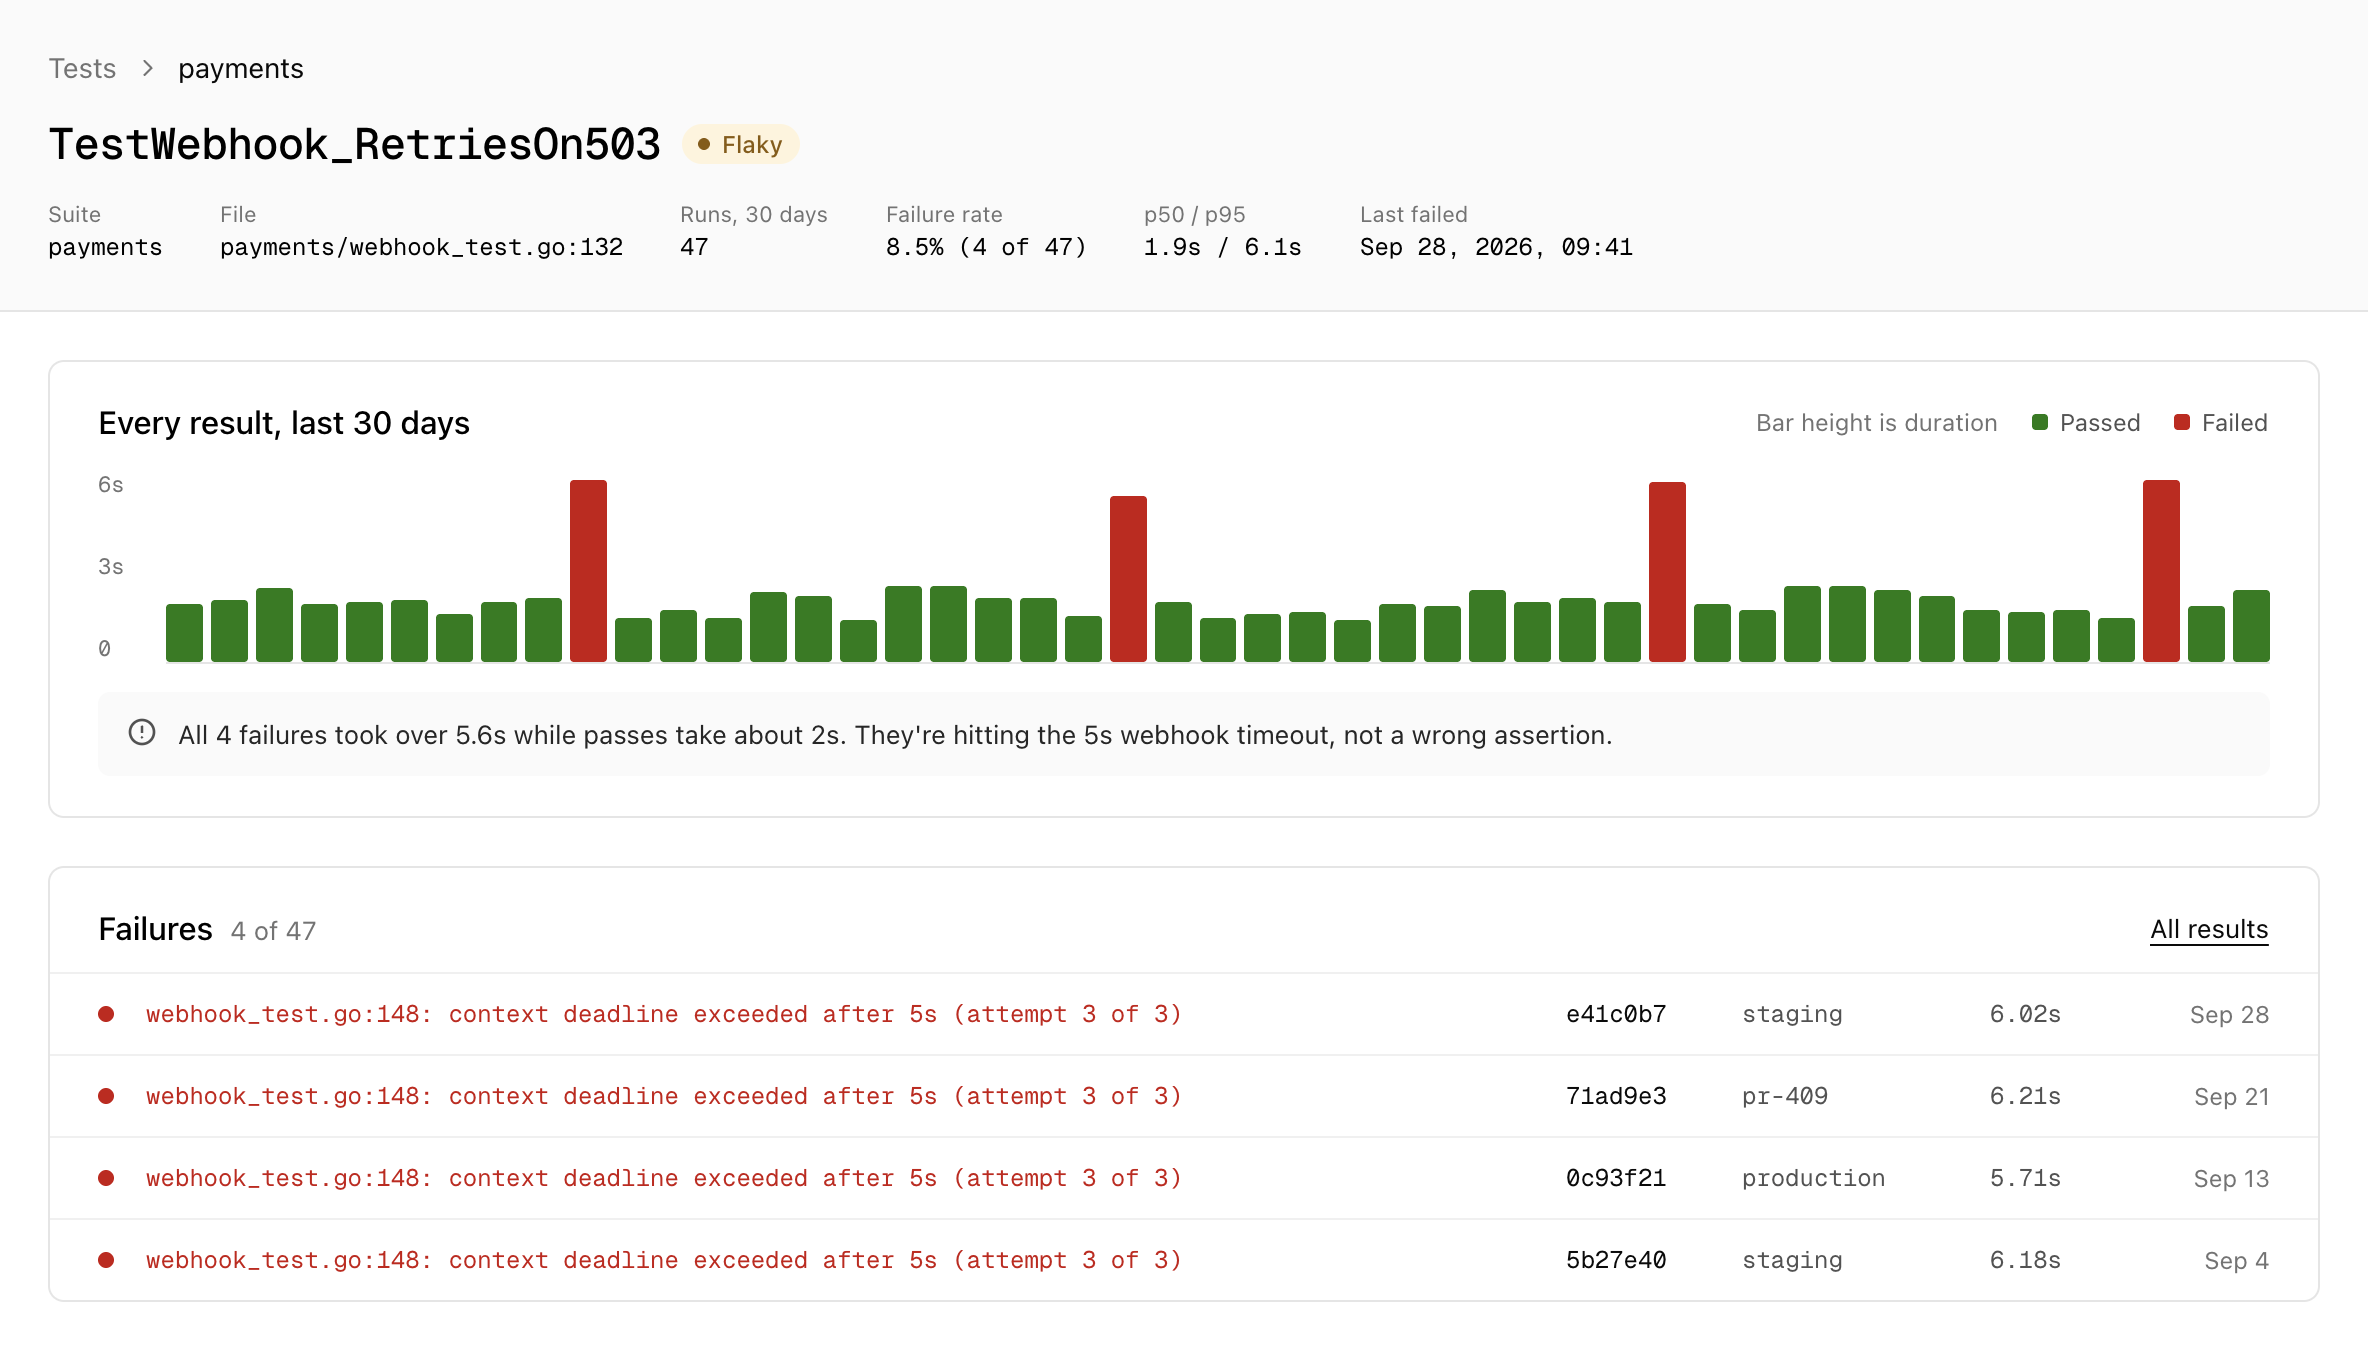
Every result shows each run of the test as one bar, and the height of the bar is how long the test took. When every failure took much longer than a passing run usually does, the page points out that the failures may be timeouts rather than wrong results. Failures lists each failure with its message, commit, environment and duration.
Durations
Durations shows where the time in your test suite goes, and which tests are getting slower. Every number is compared with the period before.
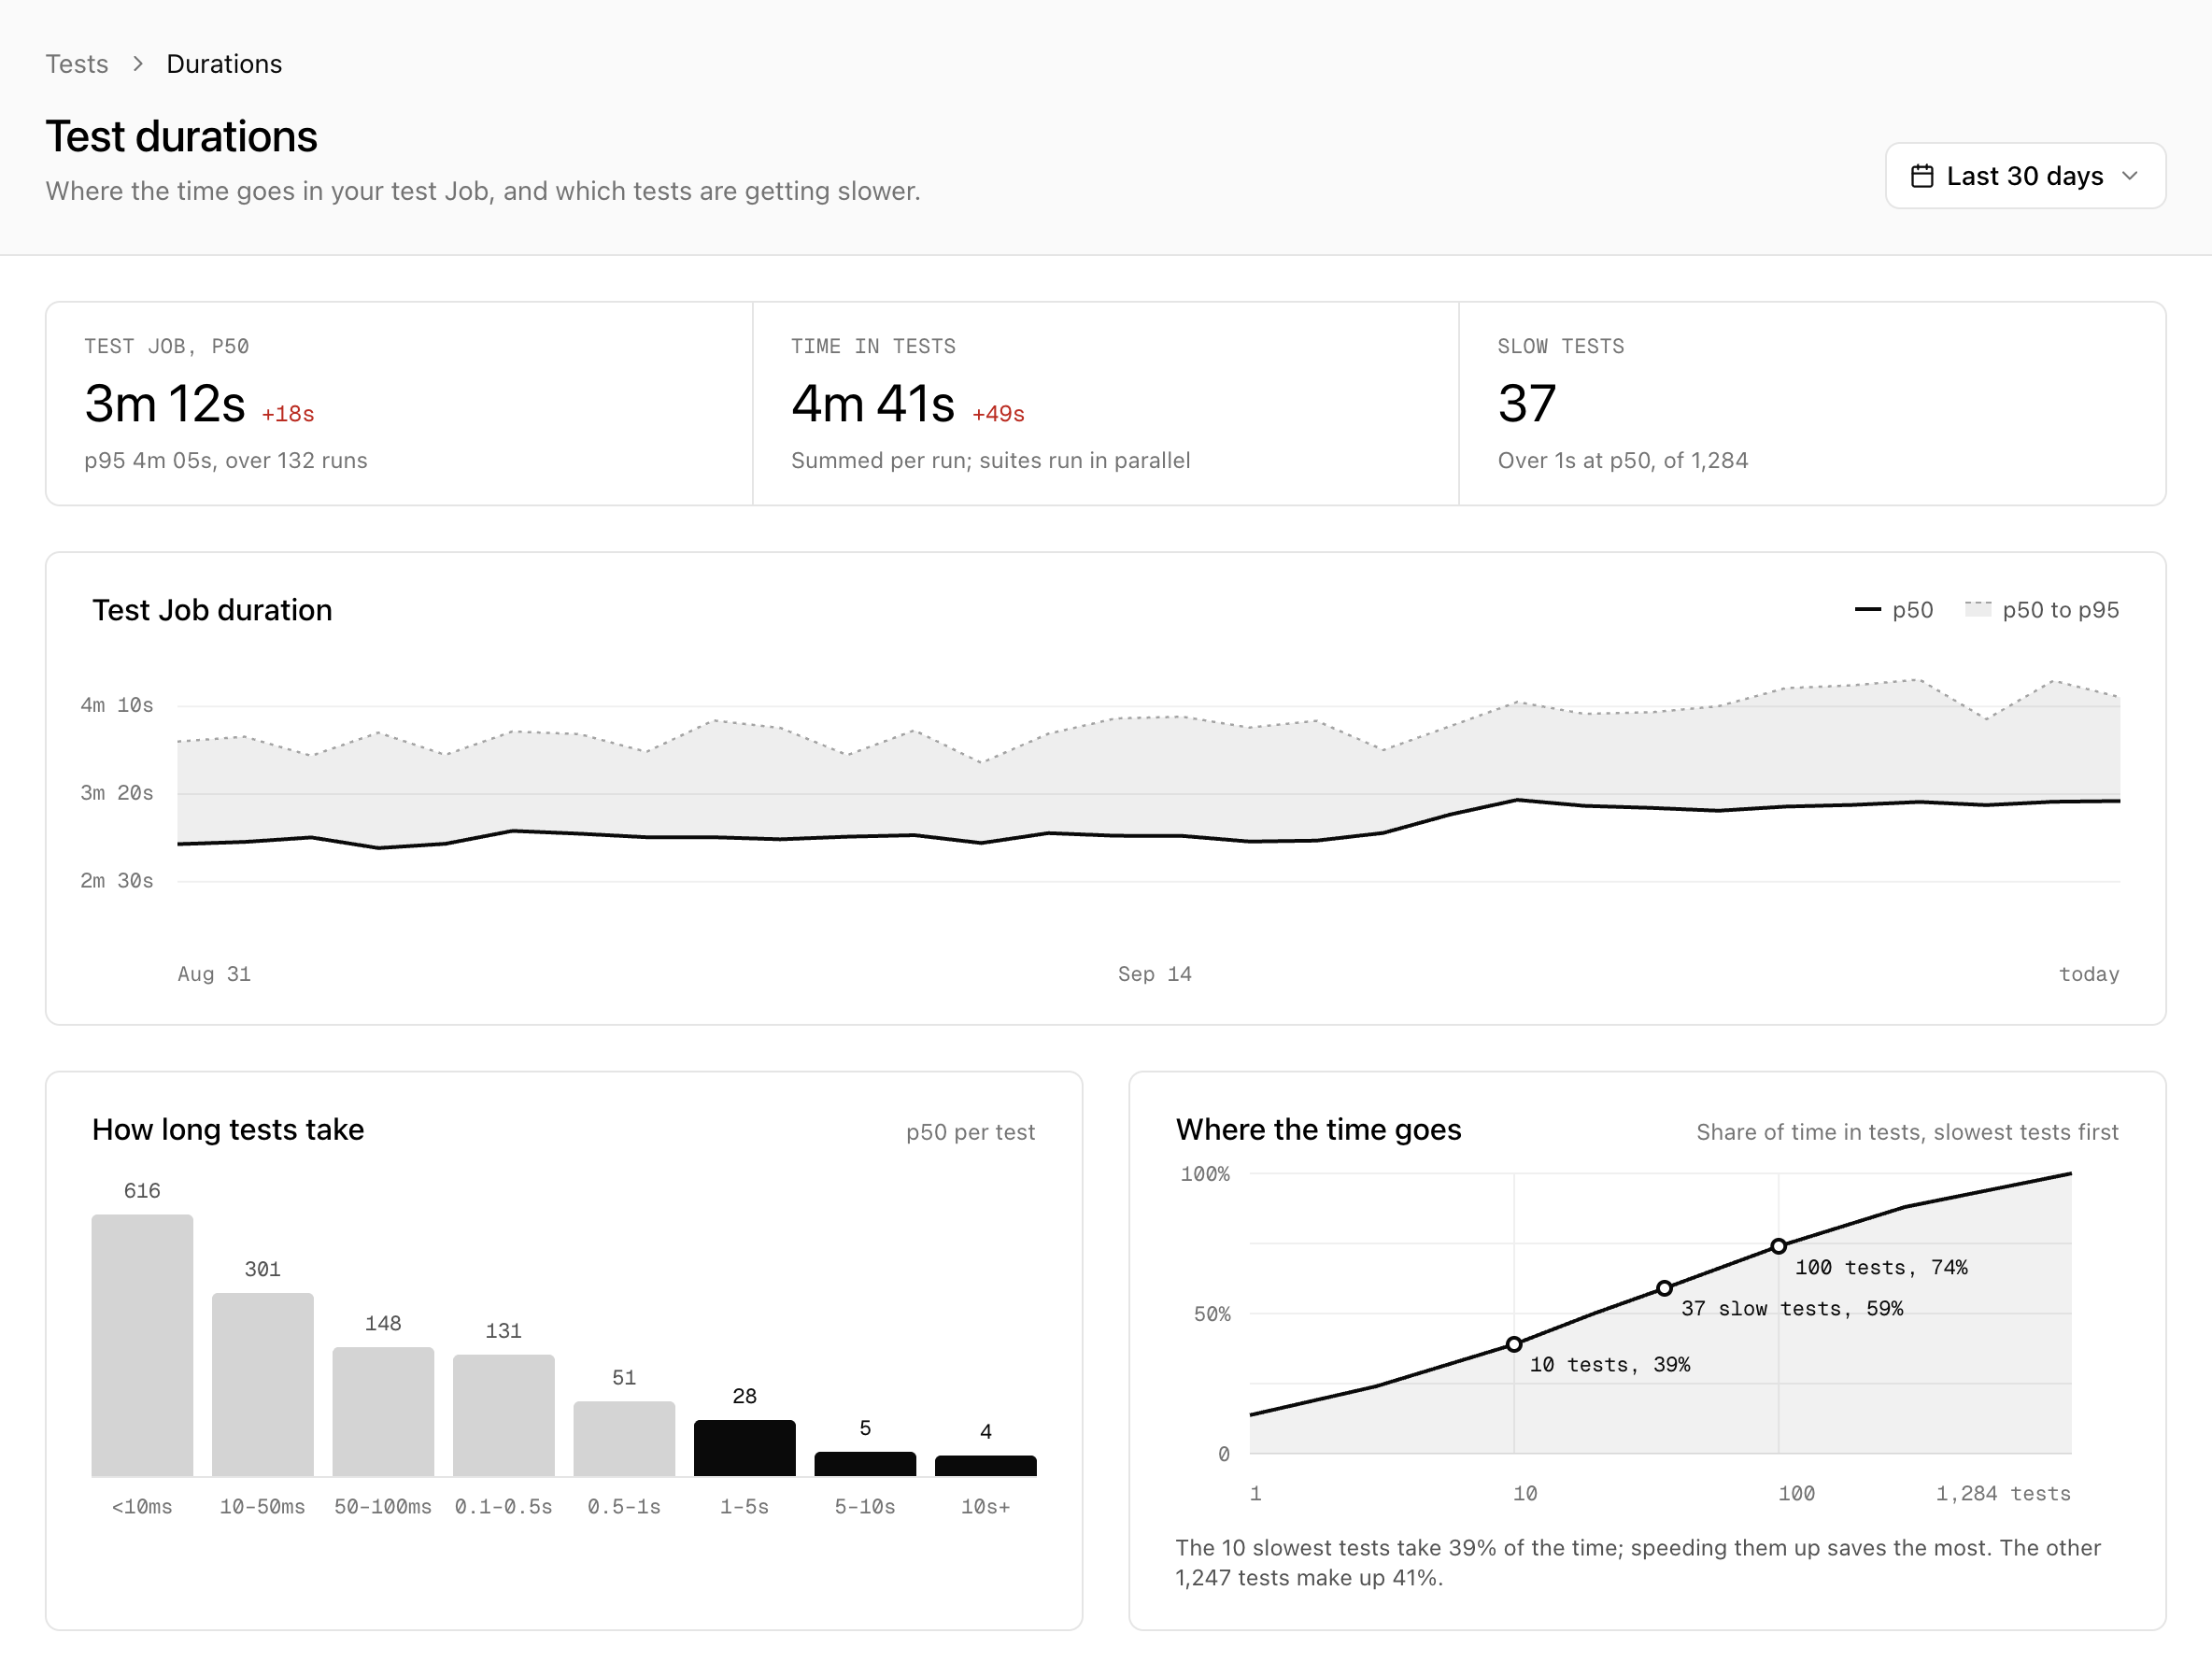
- Test Job, p50 is the median wall time of the test step of your builds. Test Job duration charts it over time together with its p95.
- Time in tests adds up every test's average duration. That is how long a run would take if the tests ran one after another, which makes it the time you save by speeding tests up. It is usually longer than the test step itself, because suites run in parallel.
- Slow tests counts the tests with a p50 of one second or more.
- How long tests take groups the tests by their p50, and Where the time goes shows the share of the total time that the slowest tests take.
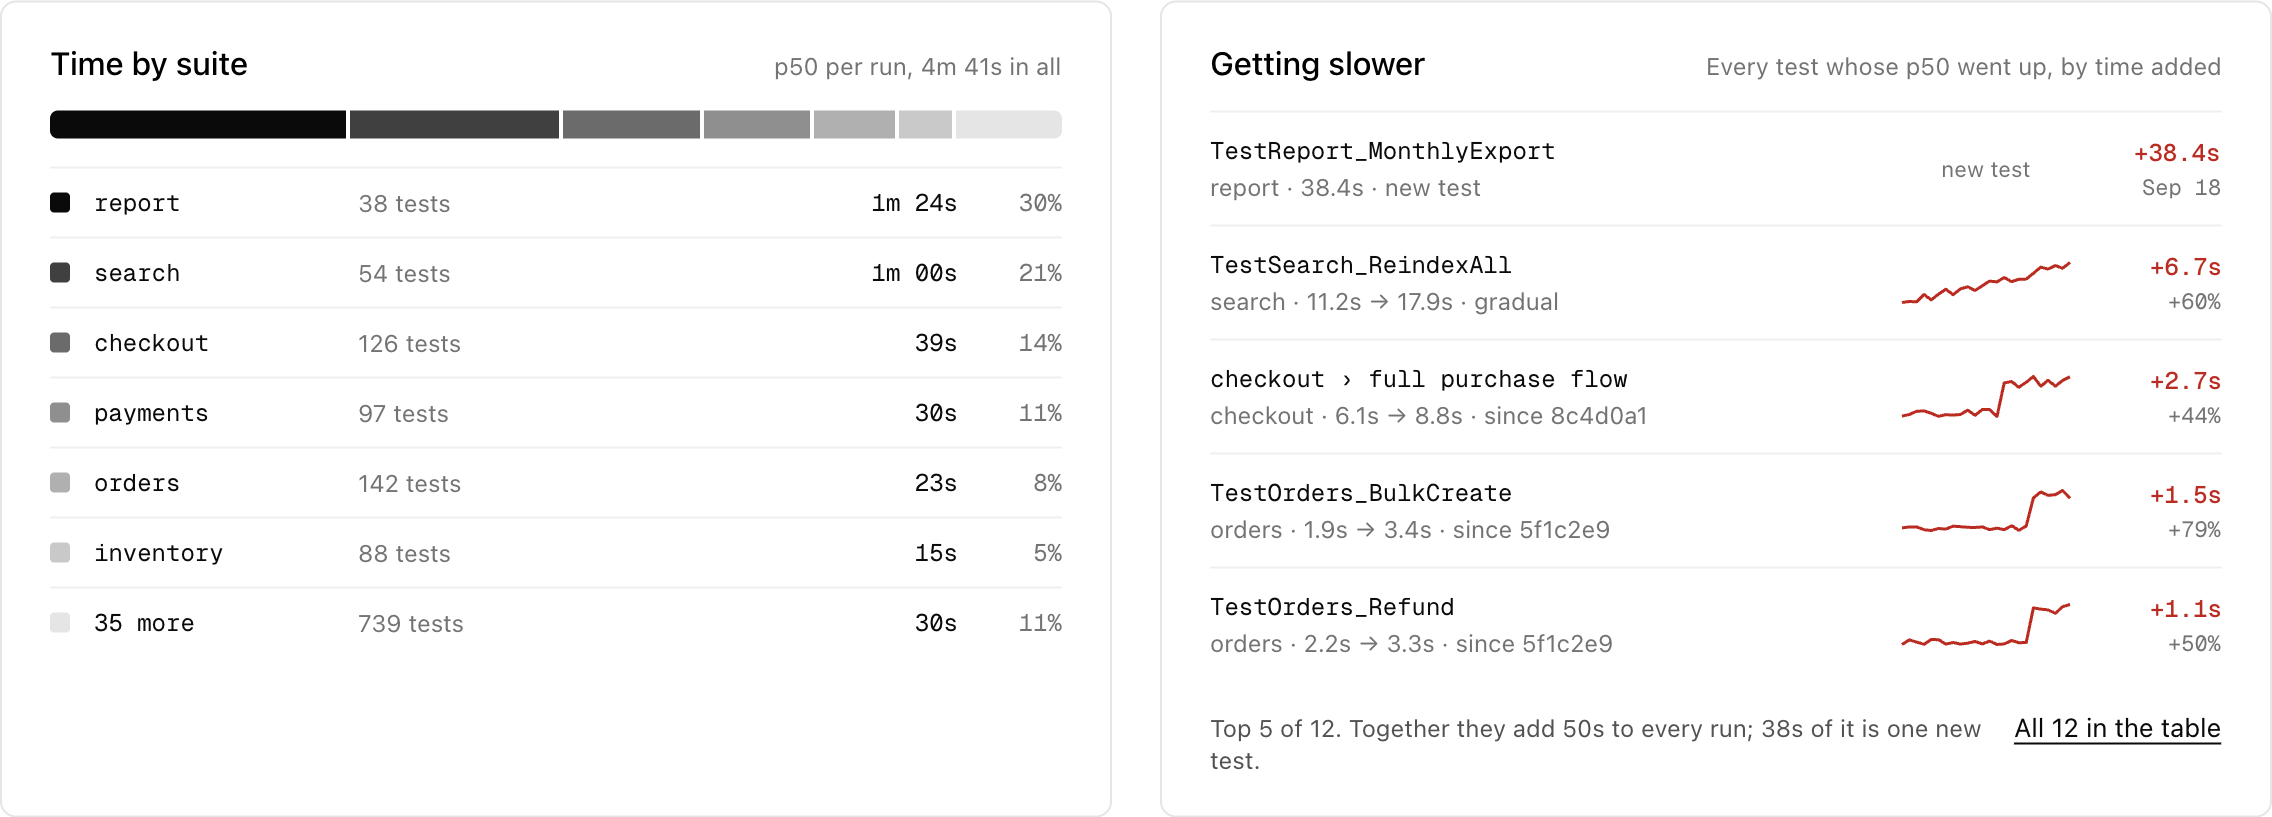
Time by suite breaks the time down by suite. Getting slower lists the tests whose p50 went up the most compared with the period before.
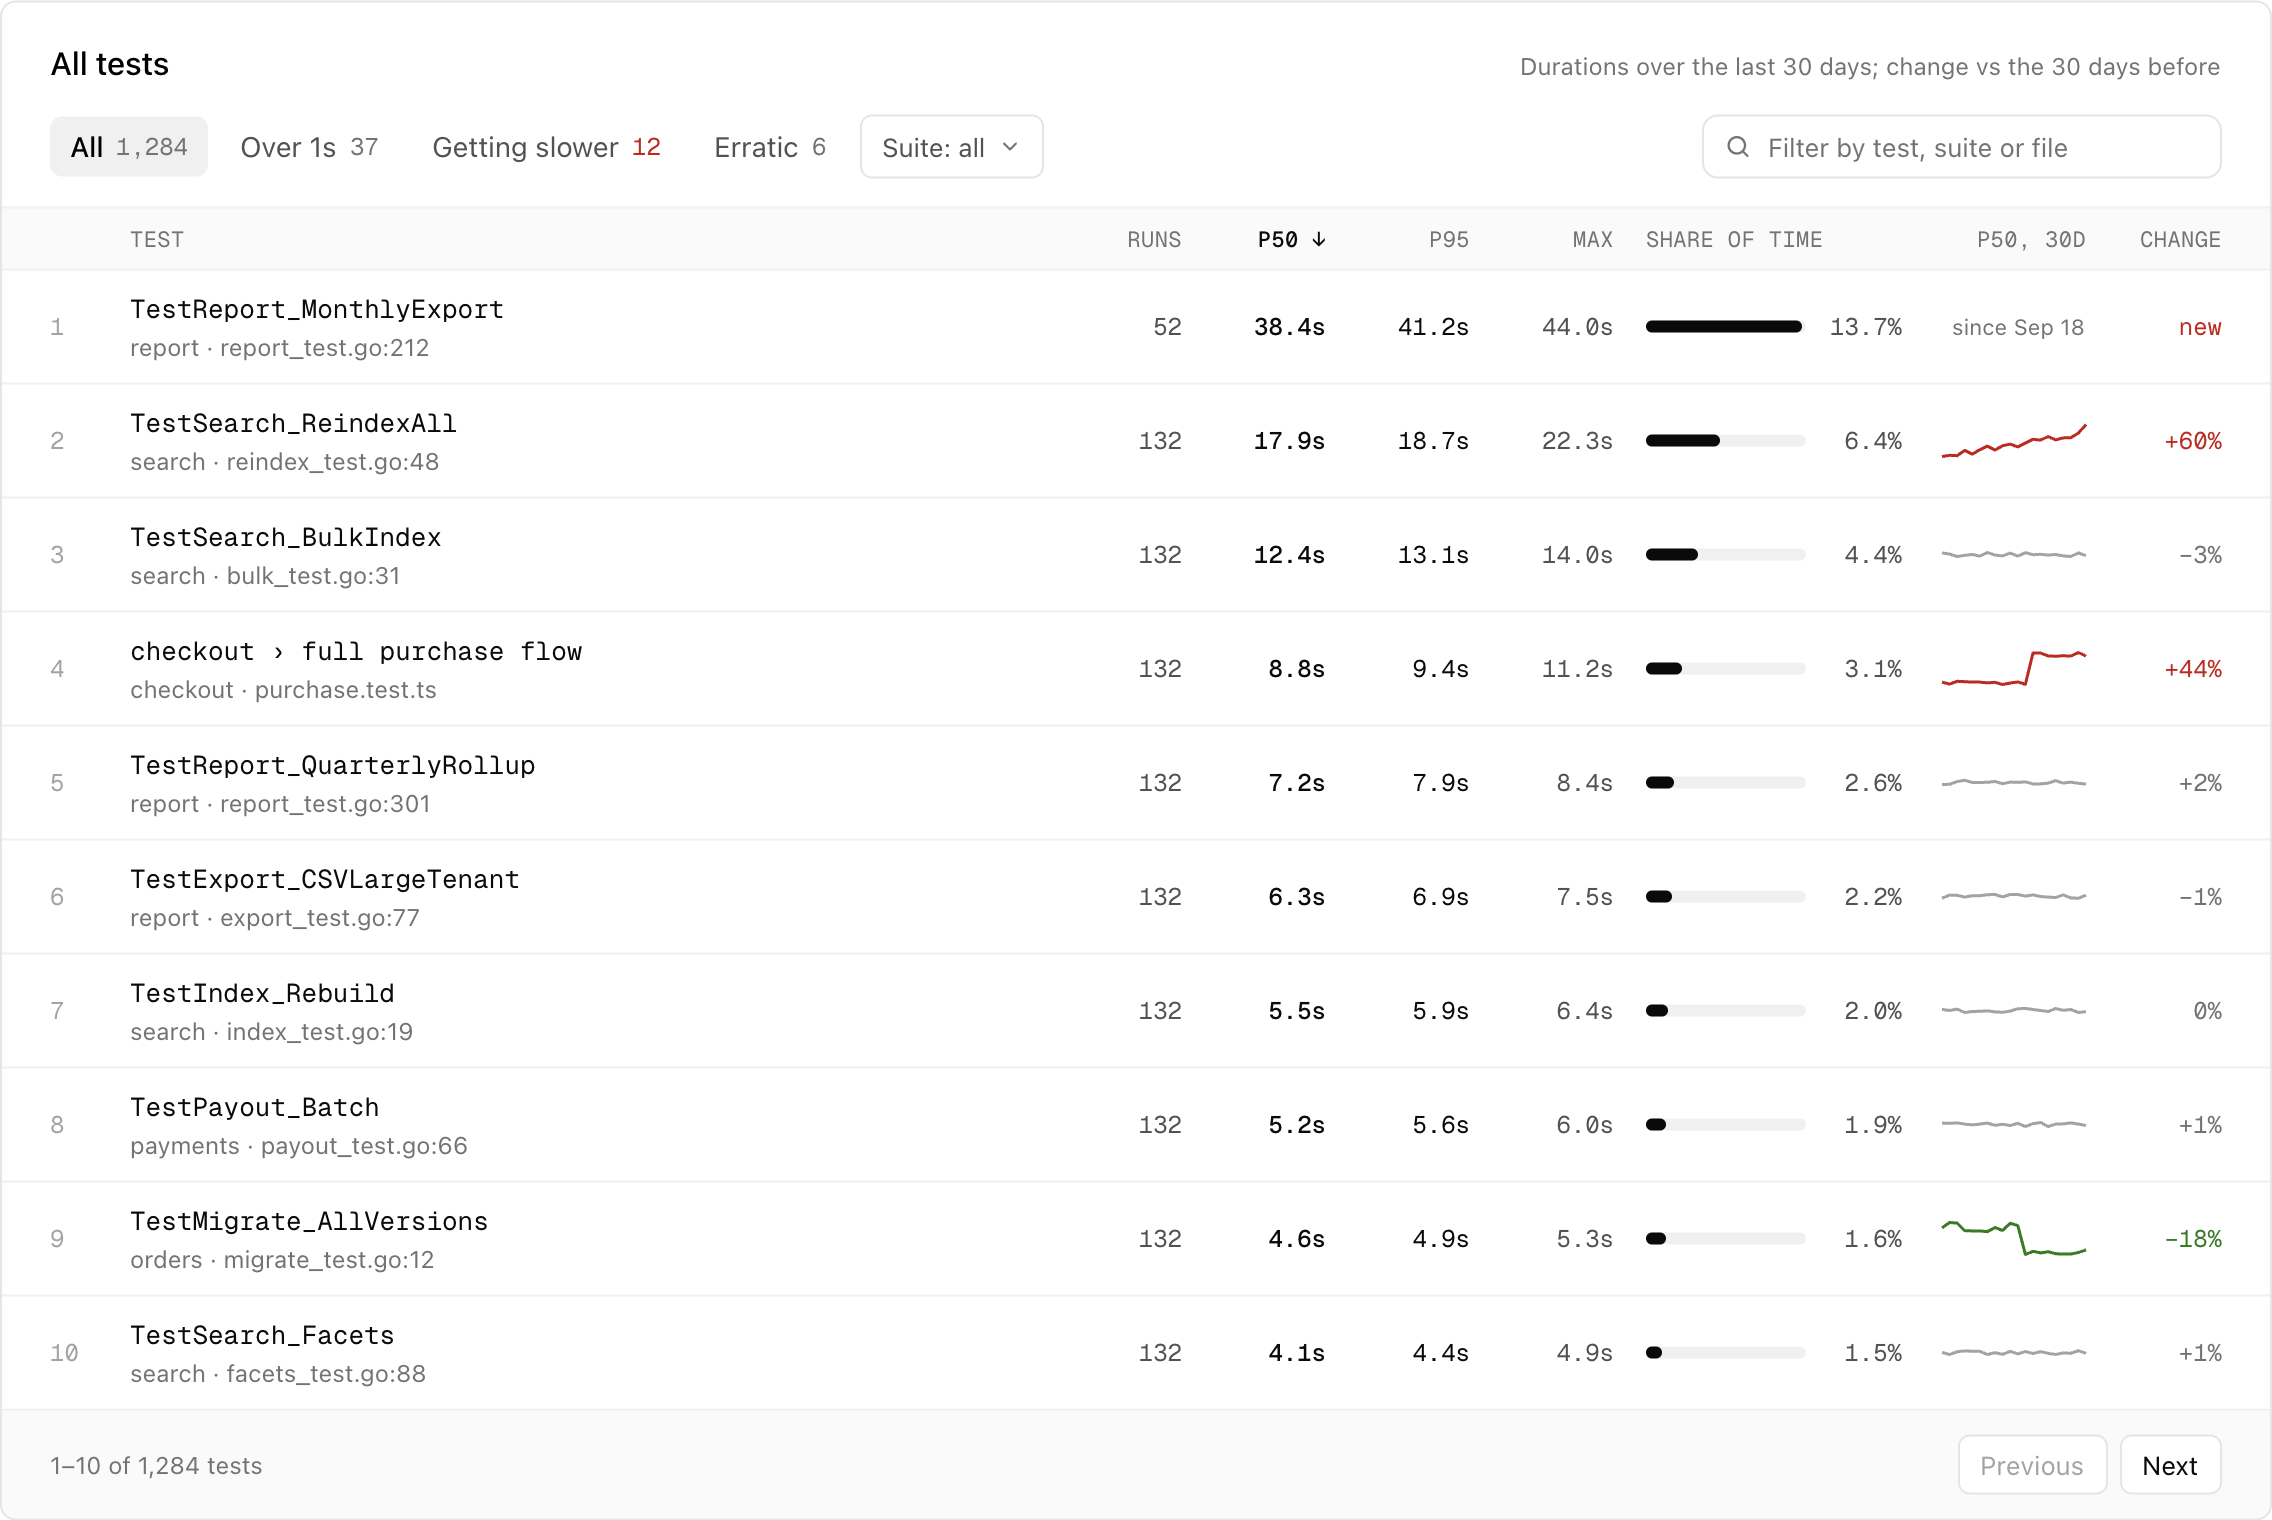
All tests lists every test with its runs, p50, p95, slowest run, share of the total time, and how its p50 changed. Search by test, suite or file, and narrow the list down to:
- Over 1s: tests with a p50 of one second or more.
- Getting slower: tests whose p50 went up compared with the period before.
- Erratic: tests whose p95 is at least twice their p50, and at least one second.
Regressions
A regression is a commit after which one or more tests became consistently and significantly slower. Regressions lists them, starting with the ones that are still open.
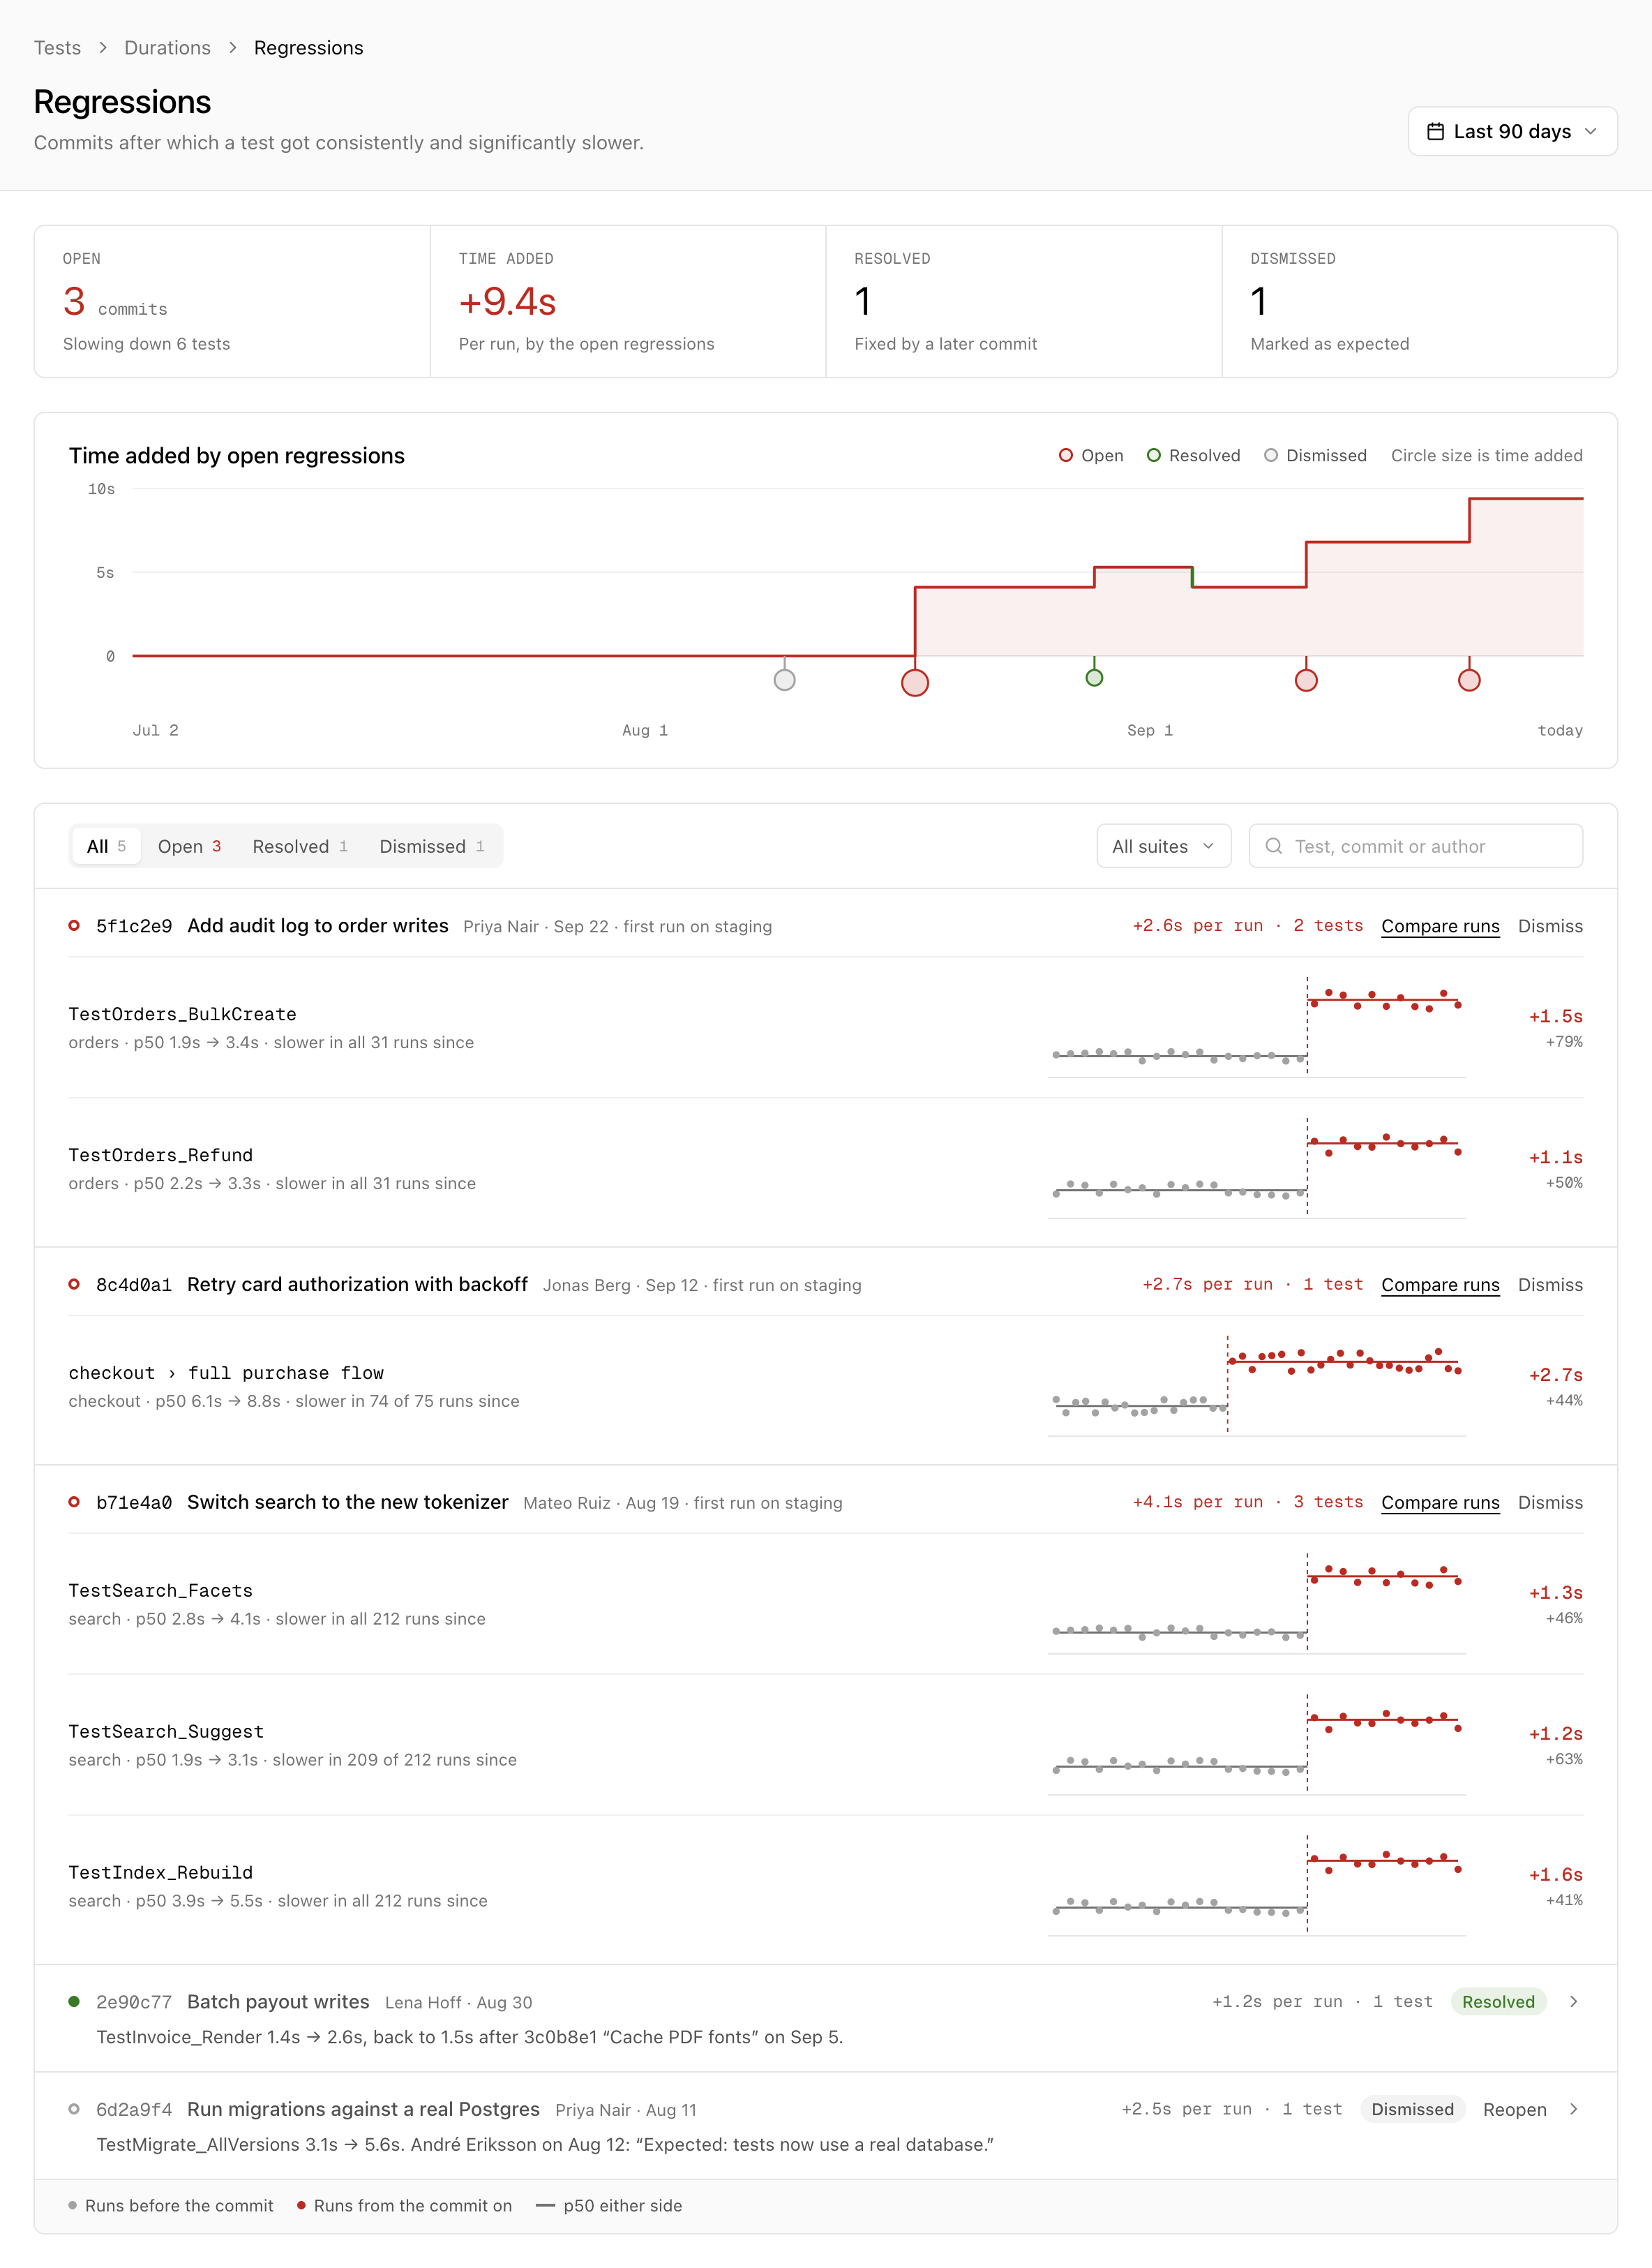
A test has regressed when its p50 went up by at least 30% and at least one second, and stayed there. Encore Cloud looks for a step up between two runs, with at least five passing runs on each side. A test that slowly drifts slower over many commits is not pinned on any one commit. It shows up under Getting slower on the Durations page instead. Only passing runs count, because failures are often timeouts.
Regressions are found on your app's main line: the runs of builds that were deployed to a production or other persistent environment, in the order they ran. Builds that only reach preview environments are left out, since their code is not on the main line yet.
Encore Cloud checks for new regressions a couple of minutes after each run. A regression is resolved once every slower test is fast again, or has not run in the last 10 main-line runs because it was removed or renamed. If a slowdown is expected, for example because a test now does more work, Dismiss it with a reason. A dismissed regression can be reopened. Dismissing and reopening requires the Admin or Writer role.
Compare runs
Compare runs compares the test durations and results of two sets of runs, such as the last 20 runs before a commit against the runs from that commit on. Comparing sets of runs rather than two single runs keeps one noisy run from deciding the outcome. Open it with Compare runs on a regression, which compares the runs before and after its commit, or with Compare durations on a test run.
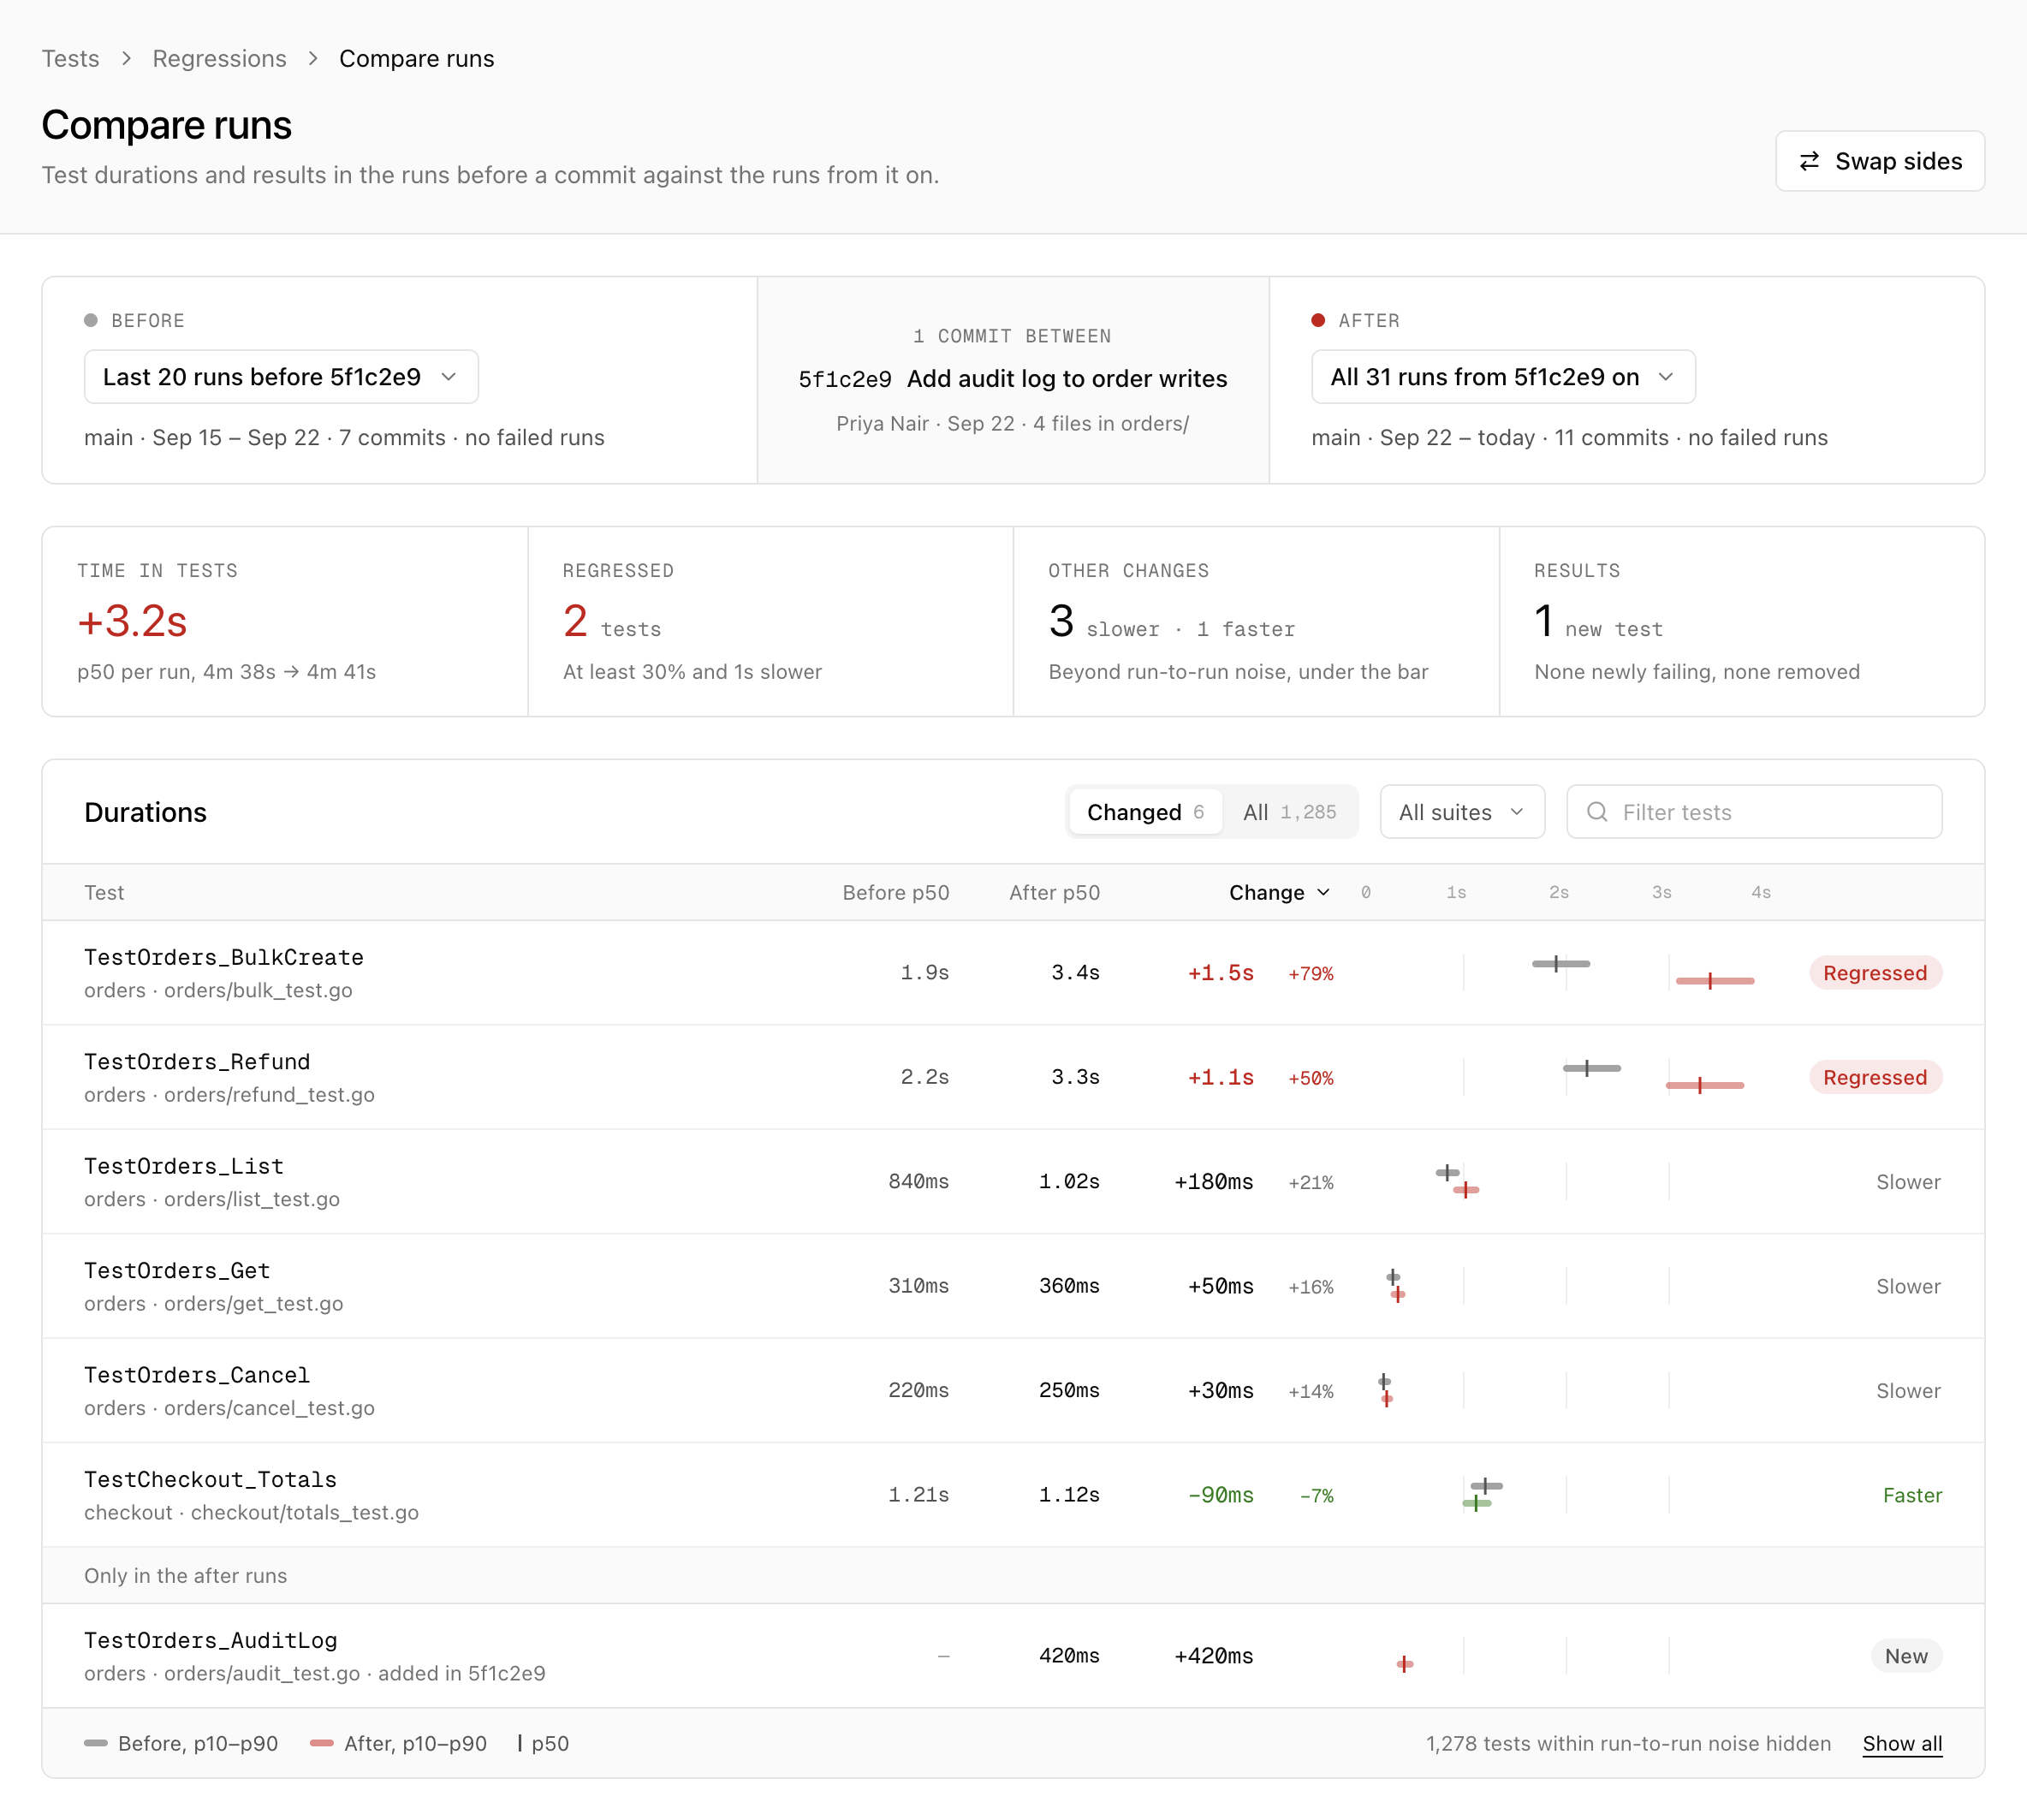
Each test is labeled by how its p50 changed:
- Regressed: slower by at least 30% and one second, the same threshold as for regressions.
- Slower or Faster: changed by more than the normal run-to-run variation, but below that threshold.
- New or Removed: only in the runs after, or only in the runs before.
Changes within the normal run-to-run variation are hidden until you select Show all. With at least three passing results on each side, a change must be statistically significant and at least 10ms and 5%. With fewer results, it must be at least 50ms and 20%.
Cached test results
Go caches the results of test packages that haven't changed, and reports them as (cached) instead of running them again. Encore Cloud records these results as cached:
- A cached result still counts as a run, and as a pass or a failure.
- A cached result's duration comes from an earlier run, so it's left out of every duration statistic, from percentiles and regressions to comparisons.
- Cached results are left out of flakiness too, because a replayed pass is not another attempt.
- In totals such as Time in tests, a cached result counts as taking no time, because it didn't.
Cached results are marked cached where their duration would be shown, and runs show how many of their results were cached.
Access and retention
Anyone who can view the app's code can view its test results. That includes the Admin, Writer and Reader roles. Failure output can contain source code, so test results are never visible to someone who can't see the code.
Test results are kept for one year. The history of a single test covers up to the last 90 days.