What Is Amazon CloudWatch? Metrics, Logs and Alarms for Backends
Amazon CloudWatch collects metrics, logs and alarms for AWS workloads. What each signal is for, how dashboards and log insights fit backends, and how Encore observability runs on your cloud alongside CloudWatch Logs.


Amazon CloudWatch is the default monitoring plane on AWS: metrics for aggregates, logs for process output, alarms for threshold breaches, and dashboards that put those signals in one place. Most AWS services already publish basic metrics into CloudWatch without an agent on your side.
Backends still choose what to log, which custom metrics matter, and which alarms page a human. This guide covers those CloudWatch pieces for backends, and how Encore observability sits on your cloud next to CloudWatch Logs.
Amazon CloudWatch at a glance
Metrics
A CloudWatch metric is a time-ordered series of data points in a namespace, with dimensions such as ServiceName or FunctionName. Many AWS services publish basic metrics at no extra charge; you can also publish custom metrics with the API or OpenTelemetry. You graph metrics, feed them to alarms and use them on dashboards.
For APIs, the useful starter set is request count, error count or rate, and latency (average plus a high percentile). For workers, queue depth and age-of-oldest-message beat CPU. High-cardinality dimensions (one dimension value per customer id) explode cost and clutter; keep label sets small.
Container Insights and Lambda Insights add denser system metrics for ECS, EKS and Lambda when you turn them on. They are optional layers on top of the basic service metrics, not a replacement for application-level counters.
Logs
CloudWatch Logs stores log events in log groups and streams. ECS and Fargate tasks commonly send container stdout and stderr to a log group per service. Lambda writes its own log group per function. Retention is configurable per group; unbounded retention is a quiet cost leak.
CloudWatch Logs Insights runs interactive queries over log groups so you can filter on fields, count error codes and sample slow handlers without shipping every line to another vendor first. Metric filters turn matching log patterns into CloudWatch metrics you can alarm on, which is useful when the only signal you have is a log line.
Structured JSON logs (level, message, request id, order id) query cleanly. Free-form strings that interpolate ids into the message do not.
Alarms and dashboards
A CloudWatch alarm watches a metric (or a math expression across metrics) against a threshold for a number of periods, then moves between OK, ALARM and INSUFFICIENT_DATA. Actions commonly notify an SNS topic, which fans out to email, Chat or a paging tool, or trigger autoscaling. Composite alarms combine several alarms so a single page represents a real user-facing failure instead of every noisy child metric.
Dashboards arrange graphs, alarm status and log widgets for a service or environment. Cross-account observability can centralize metrics, logs and traces from many accounts into one monitoring account when an organization outgrows a single AWS account. Start with one dashboard per critical service and one alarm on user-visible error rate before building a wall of charts nobody watches.
How Encore observability works on your cloud

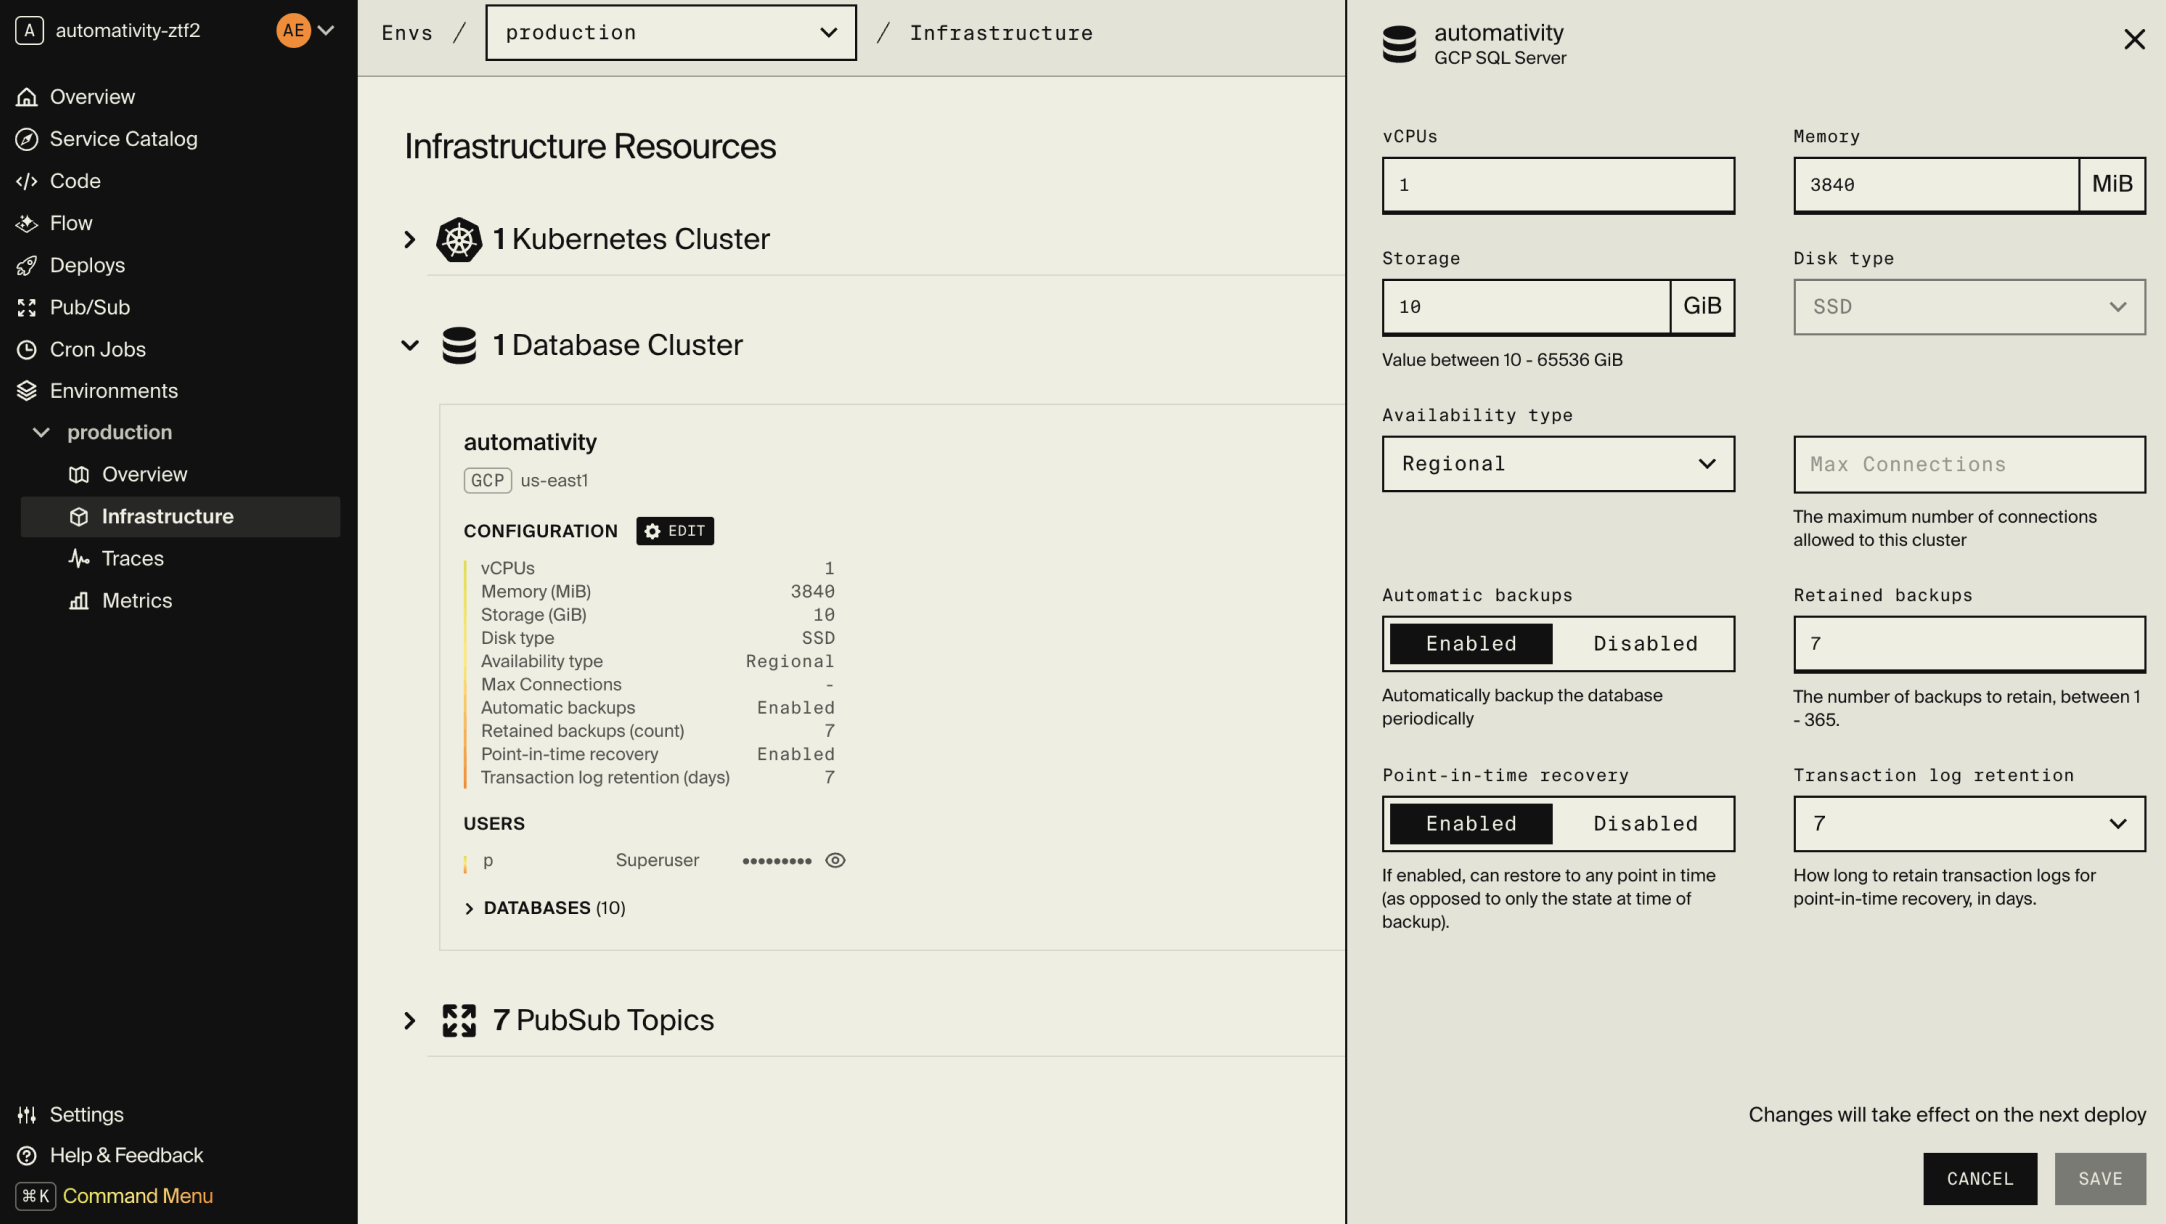
Container and operational logs in Encore are infrastructure from code. The platform provisions and deploys into your own AWS or GCP account. On AWS, Encore configures CloudWatch Logs so container and operational logs land in your account, and Encore provisions an IAM role for the service, as described in the AWS infrastructure docs. Application-level metrics and distributed traces are part of Encore's own observability model rather than a thin wrapper around every CloudWatch product feature.
You define custom counters and gauges in code. They show up in the Encore platform dashboard, and the platform can forward them to Grafana Cloud or Datadog when you connect those integrations in environment settings (platform metrics docs). Distributed tracing is automatic across API calls, database queries and Pub/Sub in every environment, including local development (tracing docs). Structured application logs use encore.dev/log and attach to the active trace (TypeScript logging).
Encore does not replace CloudWatch as the AWS control-plane monitor for RDS CPU or ALB 5xx, and this guide does not claim Encore auto-creates CloudWatch alarms or dashboards for you. Keep CloudWatch alarms on the AWS resources you care about, and use Encore traces and metrics for the request path inside the app.
Set up the app
Run in your terminal to get started locally.
A service that increments a counter and emits a structured log on each order:
// checkout/encore.service.ts
import { Service } from "encore.dev/service";
export default new Service("checkout");
Instrument the order path with a counter and a structured log line:
// checkout/orders.ts
import { api } from "encore.dev/api";
import log from "encore.dev/log";
import { Counter } from "encore.dev/metrics";

const ordersPlaced = new Counter("orders_placed");

export const place = api(
  { expose: true, method: "POST", path: "/orders" },
  async ({ sku }: { sku: string }): Promise<{ ok: boolean }> => {
    ordersPlaced.increment();
    log.info("order placed", { sku });
    return { ok: true };
  },
);
encore run serves the API locally and records traces and metrics in the local development dashboard. After you connect your AWS account, the same service runs in your account with logs flowing to CloudWatch Logs and request traces available in the Encore platform dashboard. The TypeScript metrics docs cover counters, gauges and labels.
An AI coding agent can add the counter and log fields in the same change as the handler, exercise the path under encore run, and leave AWS alarm thresholds to the team that owns the on-call policy.
Best fit: Teams who want metrics, logs and traces for backends in their own AWS account, with CloudWatch Logs for containers and Encore for application traces and custom metrics.
Good to know
- Alarm on user-visible symptoms (5xx rate, checkout latency) before alarming on every CPU blip.
- Set log retention on every group; default forever is an expensive habit.
- Keep custom metric dimensions coarse enough that time series stay in the tens or hundreds, not thousands.
- Use Logs Insights for recent investigations; ship long-term analytics elsewhere if you need cheap unbounded history.
Related guides
Frequently asked questions
What is Amazon CloudWatch used for?
Amazon CloudWatch is AWS's monitoring service for metrics, logs, alarms and dashboards. AWS services publish many metrics automatically, applications can publish custom metrics and logs, and alarms watch thresholds so you can notify or automate when something drifts.
What is the difference between CloudWatch metrics and CloudWatch Logs?
Metrics are numeric time series (request count, CPU, latency percentiles) that you graph and alarm on. Logs are timestamped event records from containers, Lambda and applications that you search with Logs Insights. Metric filters can turn matching log lines into metrics.
Do I need CloudWatch if I already use Datadog or Grafana?
CloudWatch still earns a place for AWS-native metrics and container logs even when application dashboards live elsewhere. You can alarm on CloudWatch metrics while exporting application metrics to Grafana Cloud or Datadog, or query both sides depending on where each signal lands.
How does Encore observability relate to CloudWatch?
With Encore on AWS, container and operational logs are sent to CloudWatch Logs, and Encore provisions an IAM role for the service. Application metrics you define with encore.dev/metrics appear in the Encore platform dashboard and can be forwarded to Grafana Cloud or Datadog. Distributed traces are captured by Encore and viewed in the local and platform dashboards.
Deploy to your cloud on AWS and Google Cloud
without managing infrastructure
Encore lets developers and agents define application infrastructure directly in code, then automatically provisions it from local development to production in your AWS or GCP account.
