OpenTelemetry Instrumentation: Zero-Code, Libraries and Manual Spans
How OpenTelemetry instrumentation works for backend services, when zero-code agents are enough and when you need manual spans, what it takes to run in production, and how Encore traces services without instrumentation code.

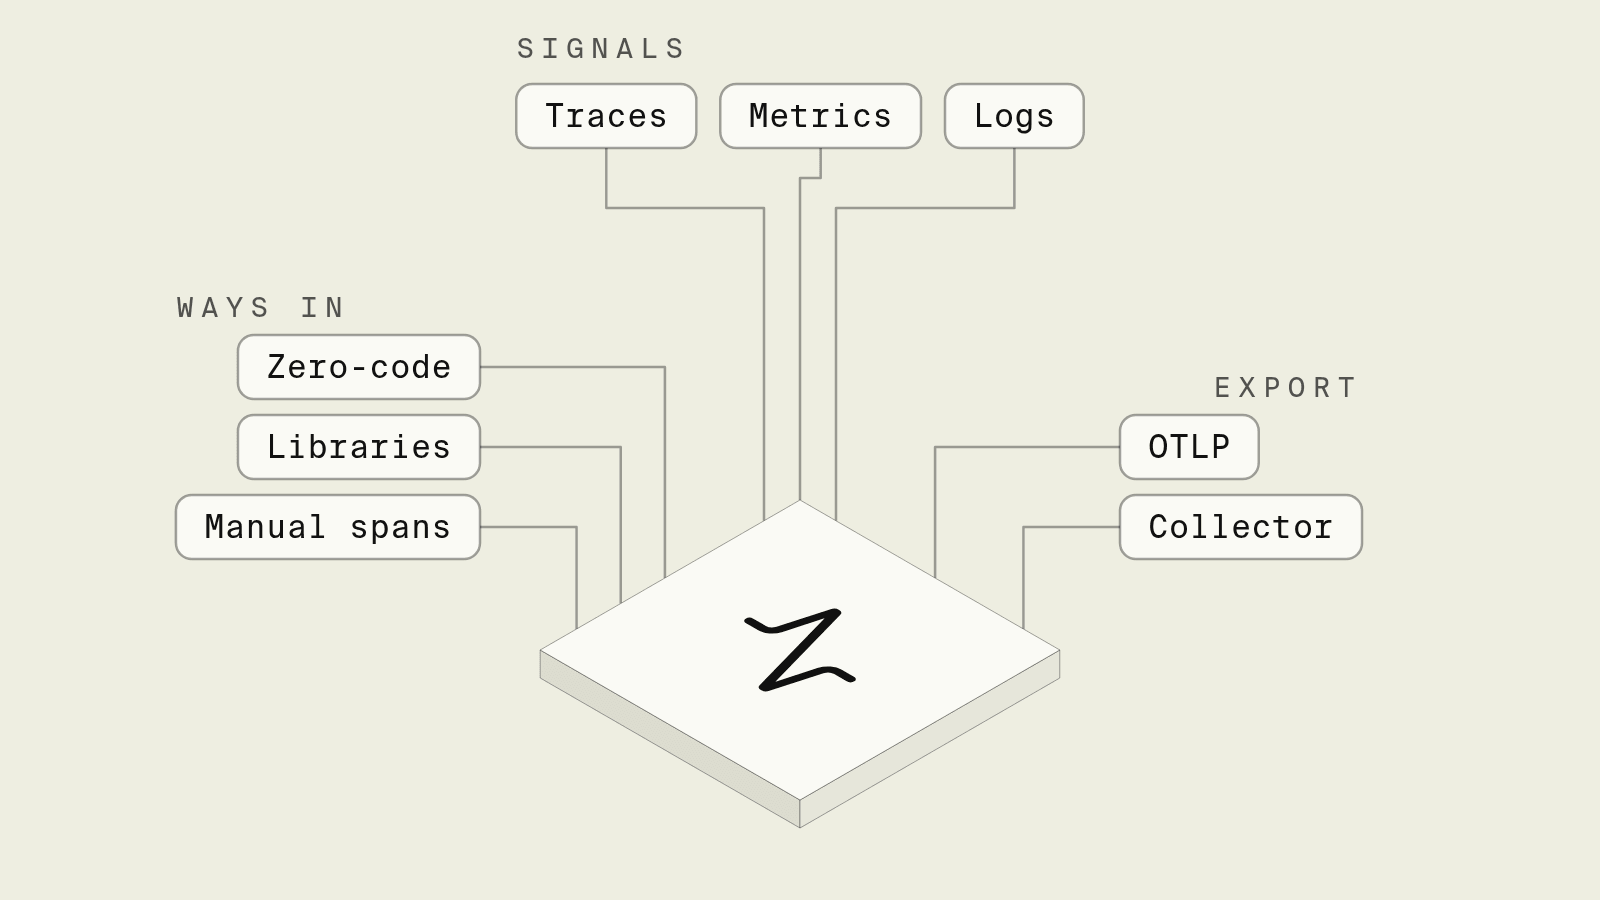
OpenTelemetry is the standard way to get traces, metrics and logs out of a backend without tying the code to one vendor, and instrumentation is the part that decides what you actually see. A zero-code agent gives you HTTP and database spans in an afternoon, and the gaps appear later: a Pub/Sub consumer whose spans are not linked to the request that published the message, a trace with no order id on it, and a Collector, sampler and backend that someone now has to run in every environment.
This guide covers the three kinds of OpenTelemetry instrumentation, what each takes in Node.js and Go, what production adds, and how Encore traces services without instrumentation code.
OpenTelemetry instrumentation at a glance
How does Encore trace services without instrumentation?

Encore combines an open source infrastructure SDK with a platform that provisions and deploys into your own AWS or GCP account. The APIs, databases, topics and service calls are declared through the SDK, so Encore knows what each operation is and records it in a trace with no instrumentation code, locally and in every environment, as the tracing docs describe.
Set up the app
Run in your terminal to get started locally.
This service writes to Postgres and publishes an event, and contains no tracing code:
// orders/orders.ts
import { api } from "encore.dev/api";
import { Topic } from "encore.dev/pubsub";
import { SQLDatabase } from "encore.dev/storage/sqldb";
import log from "encore.dev/log";

const db = new SQLDatabase("orders", { migrations: "./migrations" });

export interface OrderPlaced {
  orderId: number;
  sku: string;
}

export const orderPlaced = new Topic<OrderPlaced>("order-placed", {
  deliveryGuarantee: "at-least-once",
});

export const place = api(
  { expose: true, method: "POST", path: "/orders" },
  async ({ sku }: { sku: string }): Promise<{ orderId: number }> => {
    const row = await db.queryRow<{ id: number }>`
      INSERT INTO orders (sku) VALUES (${sku}) RETURNING id
    `;
    const orderId = row!.id;
    log.info("order placed", { orderId, sku });
    await orderPlaced.publish({ orderId, sku });
    return { orderId };
  },
);
Calling POST /orders under encore run produces one trace in the local development dashboard with the request, the INSERT and its duration, the log line with its fields and the publish, and once another service subscribes to order-placed, its handling of each message joins the same trace across the queue hop. In deployed environments the same traces appear in the Encore dashboard, and metrics go to your cloud provider's monitoring service by default or to Grafana Cloud or Datadog, per the metrics docs. Fields that should not be stored, such as passwords, can be marked for redaction.
A coding agent debugging a slow endpoint can run the app, call it and read the trace without first adding spans, and every new endpoint or query it writes is traced from the first run.
Locally the same traces appear in the local development dashboard, and structured logs written with the Encore logger are attached to the trace of the request that wrote them, as the logging docs describe.
Best fit: TypeScript and Go backends that want request, database and messaging traces in development and production from the APIs and resources the code already declares, deployed in their own AWS or GCP account.
Zero-code instrumentation
Zero-code instrumentation loads at startup and patches supported libraries. In Node.js that is the @opentelemetry/auto-instrumentations-node package:
It covers common modules such as http, Express, pg, ioredis and the AWS SDK, so incoming requests, queries and outgoing calls appear as spans with no code changes, as listed in the zero-code instrumentation docs. Python has opentelemetry-instrument, Java and .NET have agents, and Go, which cannot patch code at runtime, has an eBPF-based auto-instrumentation project that runs alongside the process. The limit is coverage: anything not on the supported list, such as a custom queue client, is invisible, and spans only carry technical attributes like the route and SQL statement.
Best fit: Getting a first view of an existing service without touching its code.
Instrumentation libraries
In Go the common path is wrapping components with instrumentation libraries from the contrib repository, such as otelhttp for net/http:
handler := otelhttp.NewHandler(mux, "orders")
client := &http.Client{Transport: otelhttp.NewTransport(http.DefaultTransport)}
Database drivers, gRPC and messaging clients have their own wrappers, and each one has to be added where the component is created. The process also needs a TracerProvider with an exporter and resource attributes set up in main, plus a propagator so trace context travels across services. The OpenTelemetry Go guide walks through that setup.
Best fit: Go services and any codebase where explicit wiring is preferred to runtime patching.
Manual spans
Manual instrumentation adds spans and attributes for your own logic, which is how business context gets into a trace:
import { trace, SpanStatusCode } from "@opentelemetry/api";

const tracer = trace.getTracer("orders");

export async function reserveStock(orderId: number, sku: string) {
  return tracer.startActiveSpan("reserve-stock", async (span) => {
    span.setAttribute("order.id", orderId);
    span.setAttribute("order.sku", sku);
    try {
      return await inventory.reserve(sku);
    } catch (err) {
      span.recordException(err as Error);
      span.setStatus({ code: SpanStatusCode.ERROR });
      throw err;
    } finally {
      span.end();
    }
  });
}
Async boundaries are where manual work concentrates: when a worker reads from SQS or Pub/Sub, the trace context has to be injected into message attributes on publish and extracted on receive, or the consumer's spans start a new, unconnected trace. Forgetting span.end() leaks spans, and attribute names should follow the semantic conventions so backends can query them.
Best fit: Domain-specific detail on top of either of the other approaches.
What production adds
Every approach above ends at an exporter, and production needs somewhere to send it: usually an OpenTelemetry Collector running as a sidecar, daemonset or gateway, which batches, samples and forwards to a backend such as Jaeger, Grafana Tempo or a commercial vendor. Head sampling (TraceIdRatioBased) is cheap but drops error traces at the same rate as healthy ones, while tail sampling in the Collector keeps errors and slow requests at the cost of buffering whole traces in memory. Each environment, including local development, needs the pipeline running for traces to be visible there.
How to choose
Pick Encore when the services are written in TypeScript or Go and you want complete traces of requests, queries and messages locally and in your own cloud, recorded from the APIs and resources the code already declares. Use zero-code OpenTelemetry for a quick view of existing services, instrumentation libraries when wiring each component explicitly suits the codebase, and manual spans wherever a trace needs business context.
Related guides
Frequently asked questions
What is OpenTelemetry instrumentation?
Instrumentation is the code that makes an application emit traces, metrics and logs through the OpenTelemetry API. It comes in three forms: zero-code instrumentation that an agent or loader injects at startup, instrumentation libraries that wrap common frameworks and clients, and manual spans you add around your own business logic.
What is the difference between automatic and manual instrumentation?
Automatic, or zero-code, instrumentation hooks into supported libraries such as HTTP servers, database drivers and messaging clients without code changes, so it shows calls between components. Manual instrumentation uses the OpenTelemetry API to create spans and attributes inside your own functions, which is how domain details such as an order id or a retry count end up in a trace.
How do I add OpenTelemetry to a Node.js service?
Install @opentelemetry/api and @opentelemetry/auto-instrumentations-node, set OTEL_SERVICE_NAME and OTEL_EXPORTER_OTLP_ENDPOINT, and start the app with node --require @opentelemetry/auto-instrumentations-node/register app.js. Add manual spans with trace.getTracer(name).startActiveSpan for business logic the auto-instrumentation cannot see.
Do I need to instrument an Encore app for tracing?
No. Encore captures traces automatically for API calls between services, database queries, Pub/Sub messages, outgoing HTTP requests and logs, both under encore run and in deployed environments, and shows them in the local development dashboard and the Encore dashboard.
Deploy to your cloud on AWS and Google Cloud
without managing infrastructure
Encore lets developers and agents define application infrastructure directly in code, then automatically provisions it from local development to production in your AWS or GCP account.
