Metrics & Dashboards
See how your application performs without configuring Prometheus or Grafana. Encore automatically collects metrics and provides dashboards that show what matters.
Metrics collected automatically
Encore collects application metrics without any configuration. Request rates, latencies, error rates, and resource utilization are tracked out of the box.
- ✓Request rate per endpoint
- ✓p50, p95, p99 latency
- ✓Error rate by status code
- ✓Database query duration
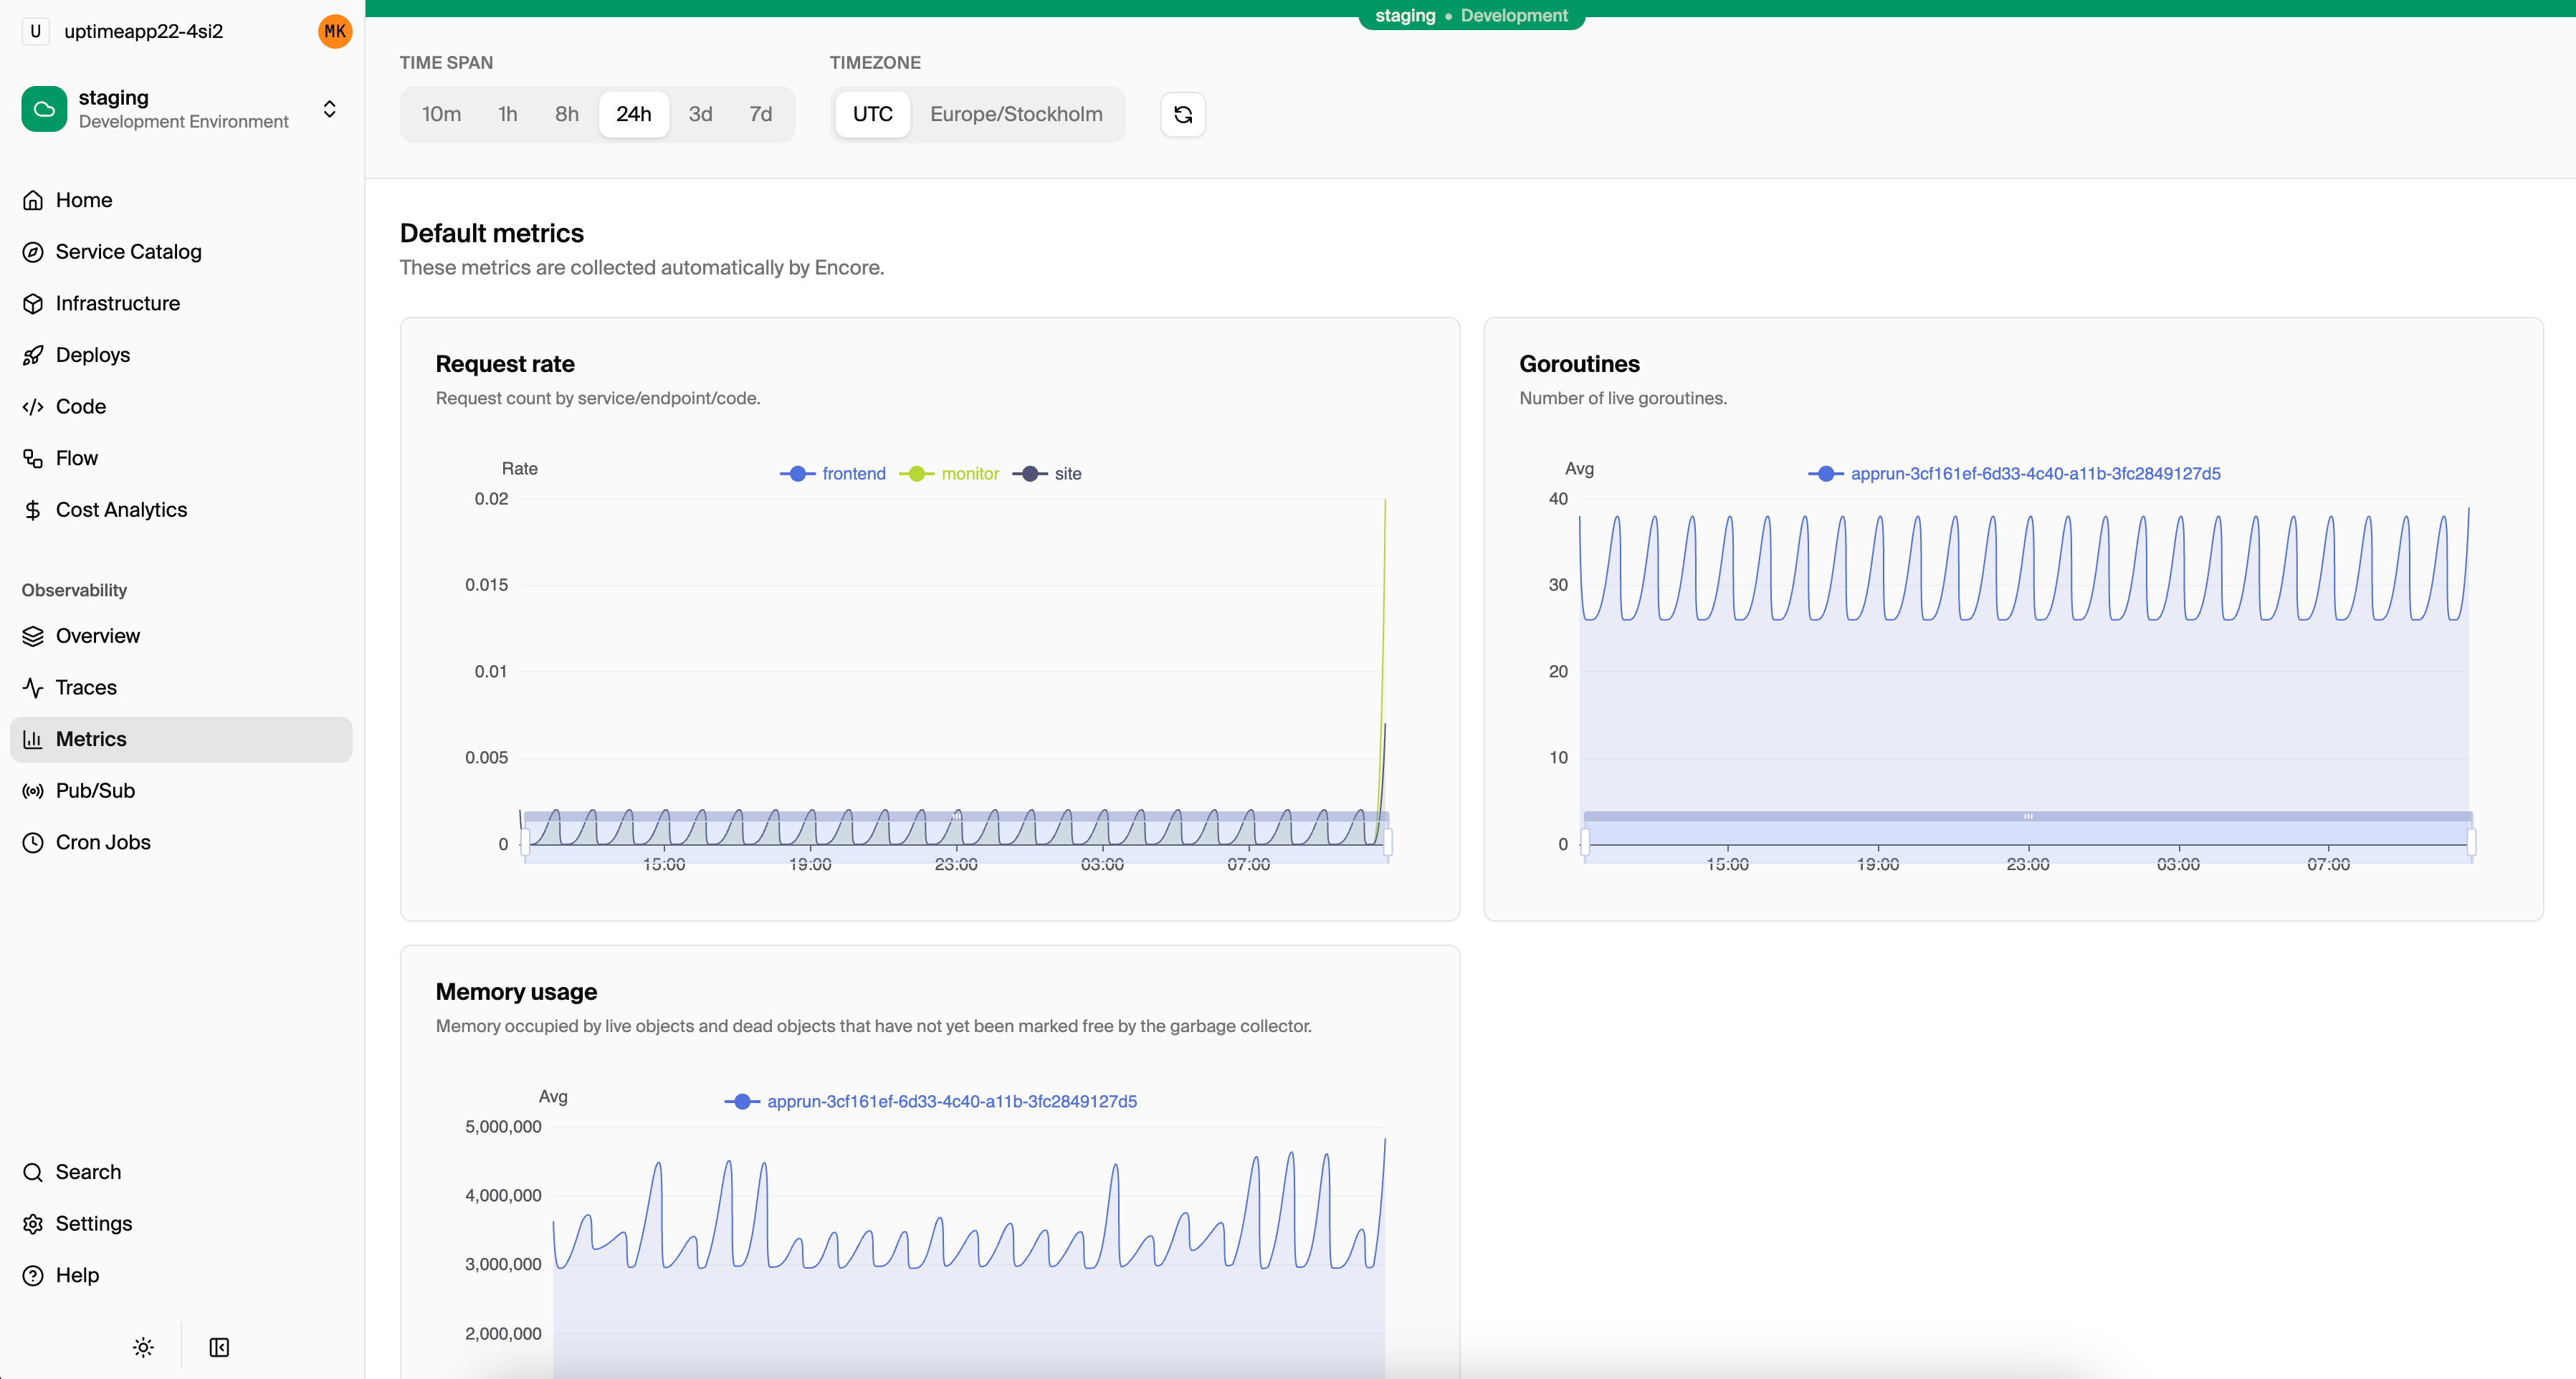
Metrics that collect themselves
Most metrics setups require instrumenting every endpoint, choosing metric names, and configuring exporters. Encore collects application metrics automatically, so you get visibility from day one.
For every API endpoint, Encore tracks request rate, latency percentiles, and error rates. For databases, it tracks query counts and durations. For pub/sub, it tracks message throughput and processing times.
- ✓Request rate per endpoint
- ✓p50, p95, p99 latency
- ✓Error rate by status code
- ✓Database query duration
- ✓Pub/Sub message throughput
- ✓Cron job execution time
Add custom metrics when you need them
Automatic metrics cover the common cases, but sometimes you need business-specific metrics. Encore provides a simple API for counters, gauges, and histograms that works locally and in production.
Custom metrics show up in the same dashboard alongside automatic metrics, and can be exported to your existing monitoring tools.
import { Counter, Histogram } from "encore.dev/metrics";

// Track orders placed
const ordersPlaced = new Counter("orders_placed", {
  labels: { status: String },
});

// Track order processing time
const processingTime = new Histogram("order_processing_ms", {
  buckets: [10, 50, 100, 500, 1000],
});

// Use them in your code
ordersPlaced.increment({ status: "completed" });
processingTime.observe(elapsed);
Export to your existing tools
Encore's built-in dashboards work immediately. If you already use Datadog, Grafana, or another monitoring tool, you can export metrics via Prometheus or OpenTelemetry.
Use both: Encore's dashboards for quick checks, and your existing tools for advanced alerting and correlation.








Stop configuring metrics
Get visibility from day one.