Going off into the wilderness for a three day hike with nothing but a pair of sandals and a six-pack of your favourite beverage might be viewed as a little silly. So too would be diving into developing and designing event-driven systems without understanding the main failure cases that you will effectively need to be aware of, and guard against.
In this post, we'll be uncovering some of the main hidden dangers you should be aware of as well as providing you with some handy bear-spray in the form of standard practices for guarding against them.
What Could Go Wrong and Why?
As with all things in life, there are inevitably trade-offs that you should be aware of when developing these systems. To extend the hiking analogy further, if you carry more equipment on your hike to protect yourself from the cold weather, or to ensure you have adequate sustenance to keep you going, then the trade-off is invariably that your hiking bag starts to become heavier, your muscles tire quickly, you might not be able to travel as far in a single day, etc.
This analogy is a good representation of how you and your team should consider event-driven architectures - you are incurring additional latency, additional infrastructure management responsibilities, additional infrastructure fees etc.
Lag - Unacceptable Additional Latency
Additional latency is one of the trade-offs of adopting an event-driven system, you are effectively adding additional hops that a message must take within your system before it has been fully processed.
You may be incurring more base latency, but the benefits you gain in terms of resiliency, and architectural simplicity can typically outweigh this incurred cost.
However, as you continue to operate and maintain your event driven system, it can become increasingly difficult to ascertain where in the system you are experiencing unexpected increases in latency.
These lag spikes can happen slowly, or it can happen all at once grinding your production services to a halt and drastically deteriorating your customer's user experience. It can also be caused by a wide number of reasons such as one of your producers not having enough memory or CPU resources allocated for it.
Or perhaps one of your service's uses an unoptimized database query that slows as more and more records are added to the underlying tables.
Whatever the cause, when it does happen, you need to be able to identify where the issues are quickly, so that you can effectively devise plans around how to reduce these latency spikes.
Identification to Planning and Remediation
When it comes to dealing with lag, you have two main steps to follow. If the title of this section didn't give the game away, these steps are:
The identification stage - finding out exactly where the bottlenecks are happening and explicitly why they are happening.
The planning and remediation stage - effectively this entails coming up with some form of plan and then implementing the plan.
Tools to help with identification
Let's focus on the identification stage here - how do you find out where in your event-driven system, who proverbially shot Roger Rabbit, or rather, what service in your system is responsible for the lag spikes?
The best way to do this, is with the help of tracing tools such as paid tools such as Honeycomb, or your own instance of the open source Jaeger offering, or perhaps Encore's built in tracing system.
Tracing is without a doubt the best way to analyse how data flows through your system and, more importantly, how long each step takes.
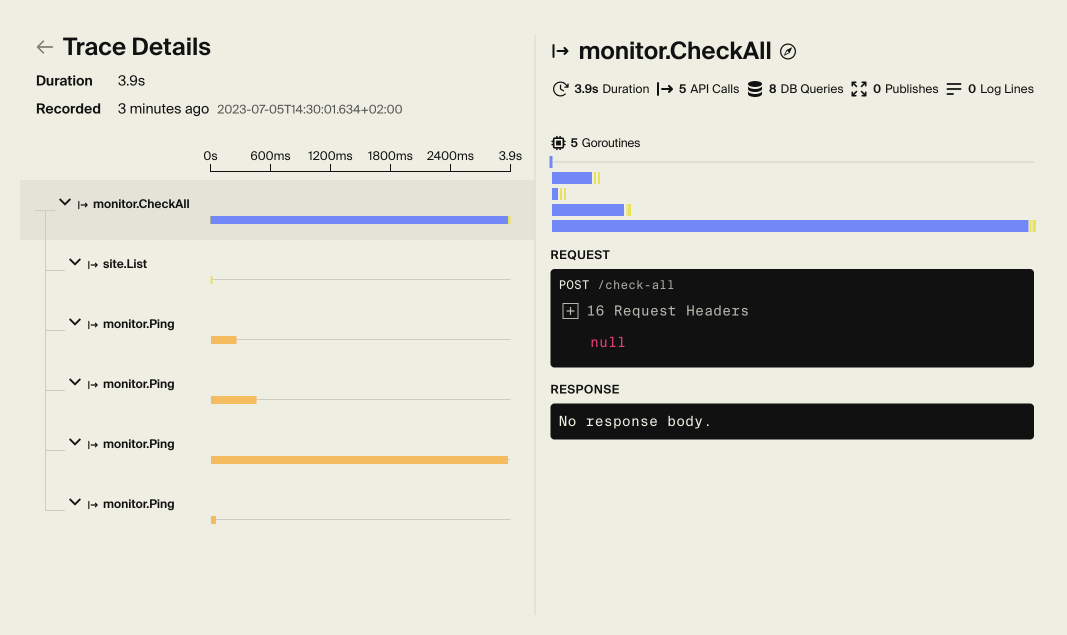
An example of an Encore trace.
Let's take a look at one such example of a trace - In this trace, we're looking at how long the CheckAll action takes within our system (an uptime monitor). It shows how long it takes in ms, which endpoints were called, and the database queries it made, etc.
Where these traces shine is with more complex actions. To quote Tom Jones, it's not unusual to see traces for your production systems with several hundreds individual actions (more commonly known as spans).
Each of these actions in your trace has a bar which directly correlates to how long the action took compared to all other actions in the trace. This is incredibly powerful with hugely complex traces, as it allows you to instantly identify where the bottlenecks in your system are with ease.
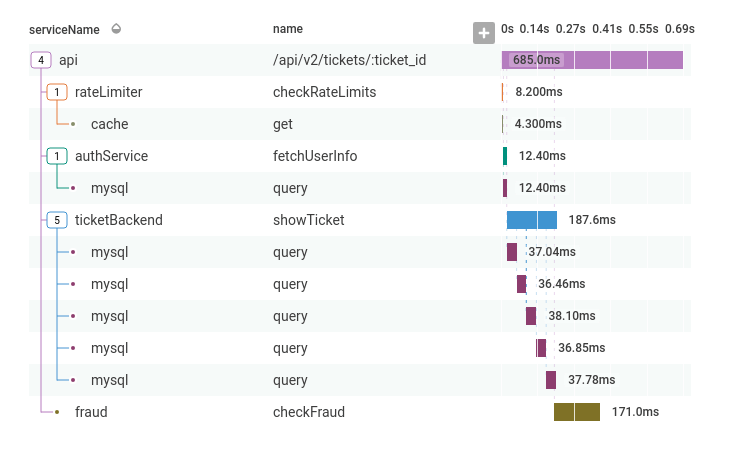
An example of a Honeycomb trace. Original source: Honeycomb
Stage 2 - Remediation
Remediation can be tricky - there's no silver bullet solution that I can offer to you as each and every case is distinct.
Upsizing your resource constrained database instance might be great for some, but for others throwing more money at the problem simply will not make the kind of impact you are after.
Typically in these situations, I'd try to write up a design doc that explicitly outlines the bottleneck, singular or plural, within the system and try to investigate some actionable steps that the team can take in order to help address these bottlenecks.
The most common occurrences and how to action against them, in my experience are:
- Expensive database queries - perhaps adding a layer of caching in front of particularly expensive and well-utilised APIs would help in this situation. Or perhaps focusing on optimising the query with the help of some SQL wizardry could be the best course of action here.
- Not Utilising Caching - sometimes, a little caching goes a heck of a long way towards reducing latency for some services. Go with caution though down this path, as caching problems can be notoriously hard to debug and fix.
- Under-provisioning your components - it's worthwhile keeping an eye on CPU and memory usage for all components within your system and ensuring that these components aren't being constrained or potentially dropping requests. Monitors and alerts can really save the day here.
Upstream Services Being Down
Hoping that all of the services that make up your product remain up and able to produce or consume messages to your event router is somewhat naive - there will come a time when inevitably even the best services will meet their maker.
It could be an EBS volume failure taking out the database, or a DNS record change that means your producer can no longer talk to your event bus. But, like us all one day, it will see the light and be brought to its proverbial knees by something unforeseen.
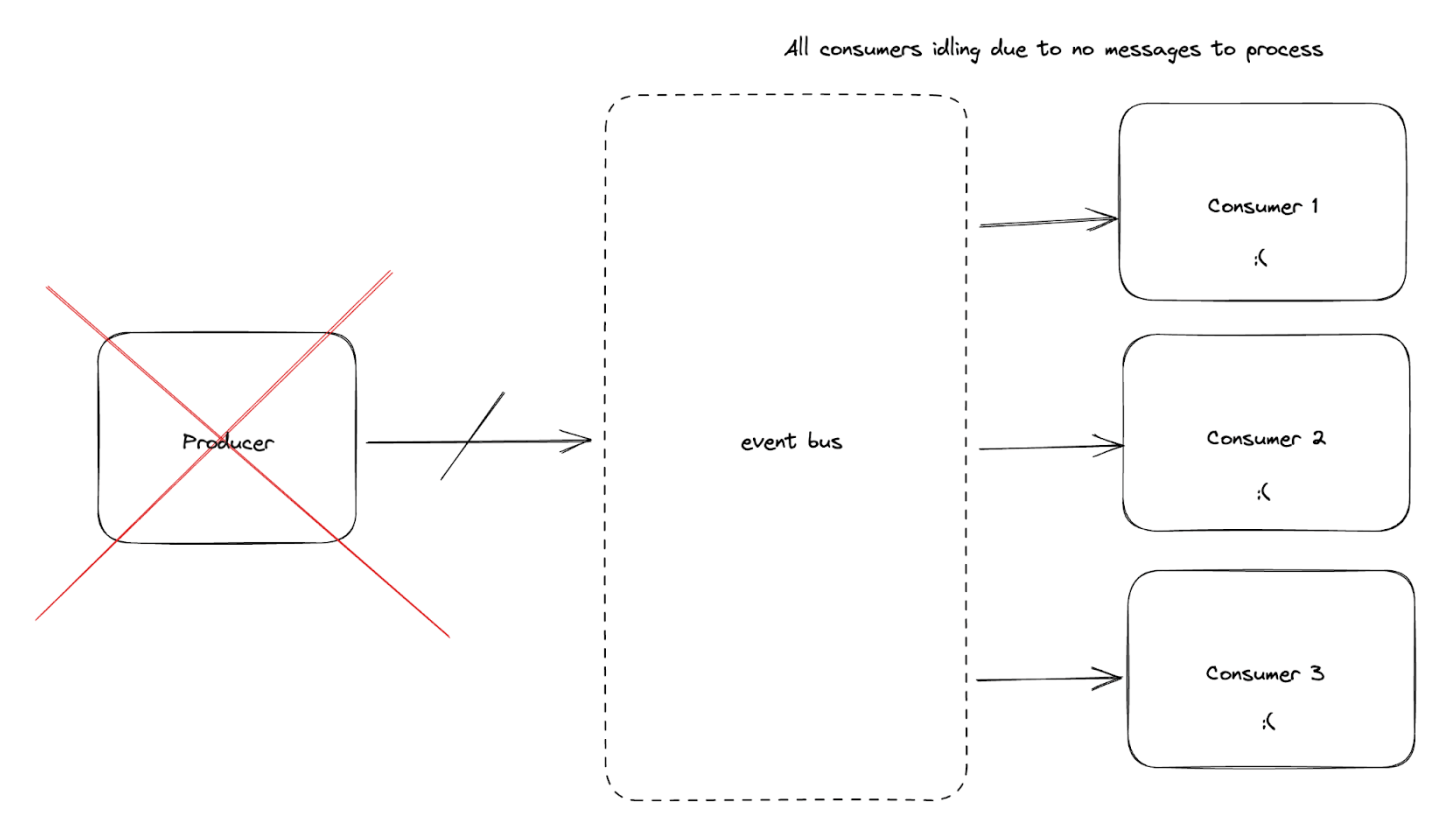
Now that we've hopefully come to terms with this fact, let's try and identify some helpful monitors for this situation that can help alert you immediately when an upstream service starts to experience some turbulence.
Anomaly Detection - Events Processed
If you have a service running in production, over time you generally start to see trends in how your system is used. Some monitoring systems, such as Datadog, allow you to set up monitors that use anomaly detection which can alert you when your service's metrics start to deviate from the regular trends.

The above image is an example of what your monitoring charts would typically look like when it comes to identifying anomalies. The purple solid line is indicative of actual traffic/events processed, the thicker grey line behind that represents the error margin for your alerts. In this example, the actual traffic has dropped well outside of the error margins in place and ultimately this should result in someone getting paged to help identify the issues.
This is hugely powerful, and one of the best types of monitor you can use for your services.
You can fully customise how sensitive this anomaly detection is to appropriately match your service's traffic volatility. Once these alerts are in place, if any of your upstream services go down for any reason, you should instantly be alerted that your consumer is processing an unusually low amount of events and you can dive in and investigate.
Spikes in Errors and/or Exceptions
If you work with particularly spiky request volumes, it's worth noting that anomaly detection will unfortunately not be a silver bullet. In these instances, defining monitors that watch for spikes in error rates over a sufficiently long time period might be a good alternative.
Publish Events Dropped to 0
If you control the upstream services that publish to the event router, you can emit metrics for every event published to the event router and subsequently set up alerts to ensure that the number of events published does not floor to 0 for a given period of time.
Infrastructure Alerts
If you own the infrastructure, having alerts put in place to monitor the disk usage, the CPU usage and memory usage is a great start. You can take this further by adding alerts such as ones based on queue depth in order to ensure that queues are consistently being consumed from.
Top Tip: If you want to minimise that unwanted latency we discussed earlier on in this article, you might want to slightly over-provision consumers such that the average queue depth for all your queues remains as low as possible.
Event Routers being down
What happens when the backbone of your architecture goes kaput? This does happen from time to time, a sufficiently large consumer might go down and suddenly the disks on your server might fill past the waterline.
All of a sudden, every service in your system is experiencing connectivity issues and instances of your application are constantly restarting to try and regain control.
The Outbox Pattern
Fret not, the Outbox Pattern can be employed here to have your producers write these messages to disk until such times as your message broker is back up and running.
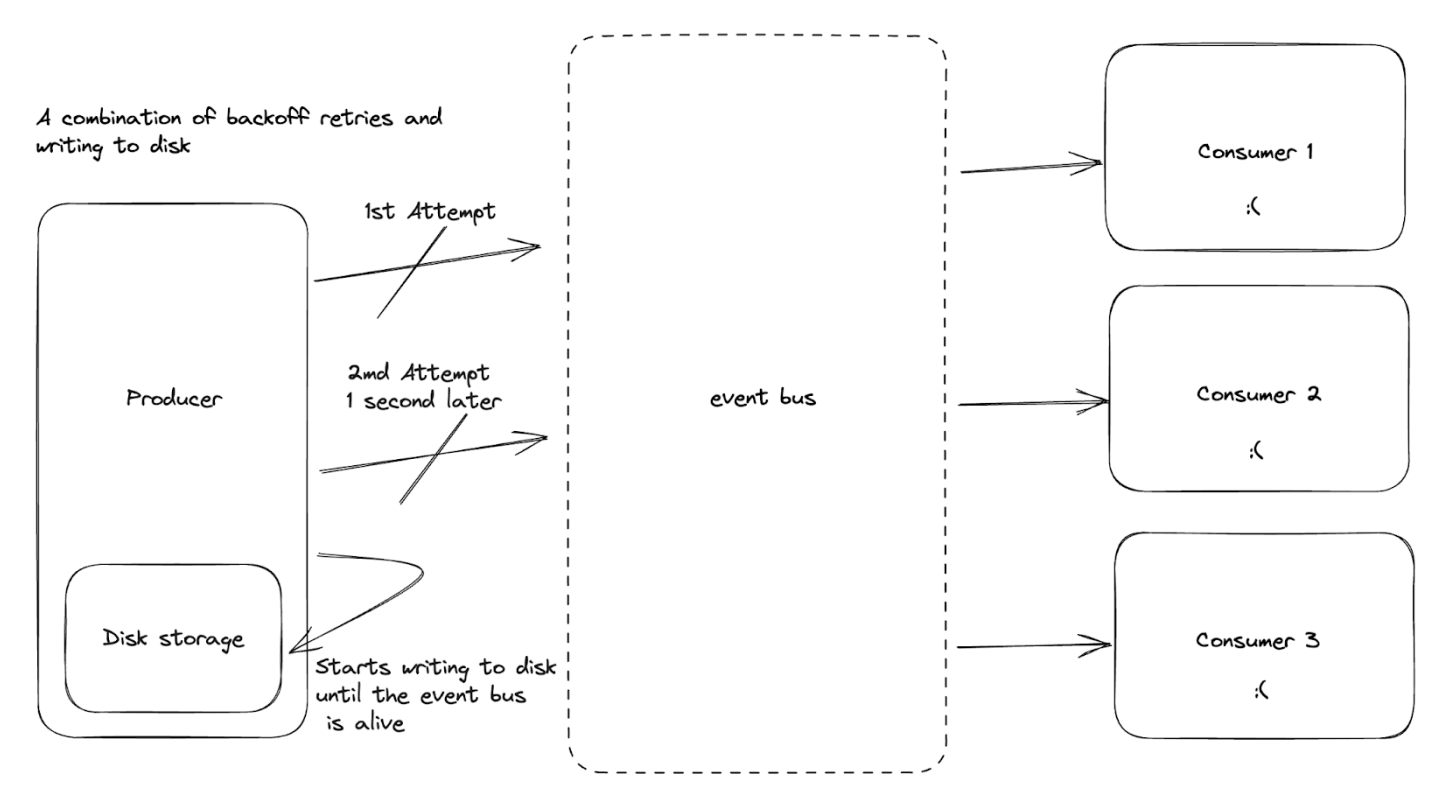
Top Tip: Services like S3 are incredibly good alternatives if you run services on pods with ephemeral disk storage.
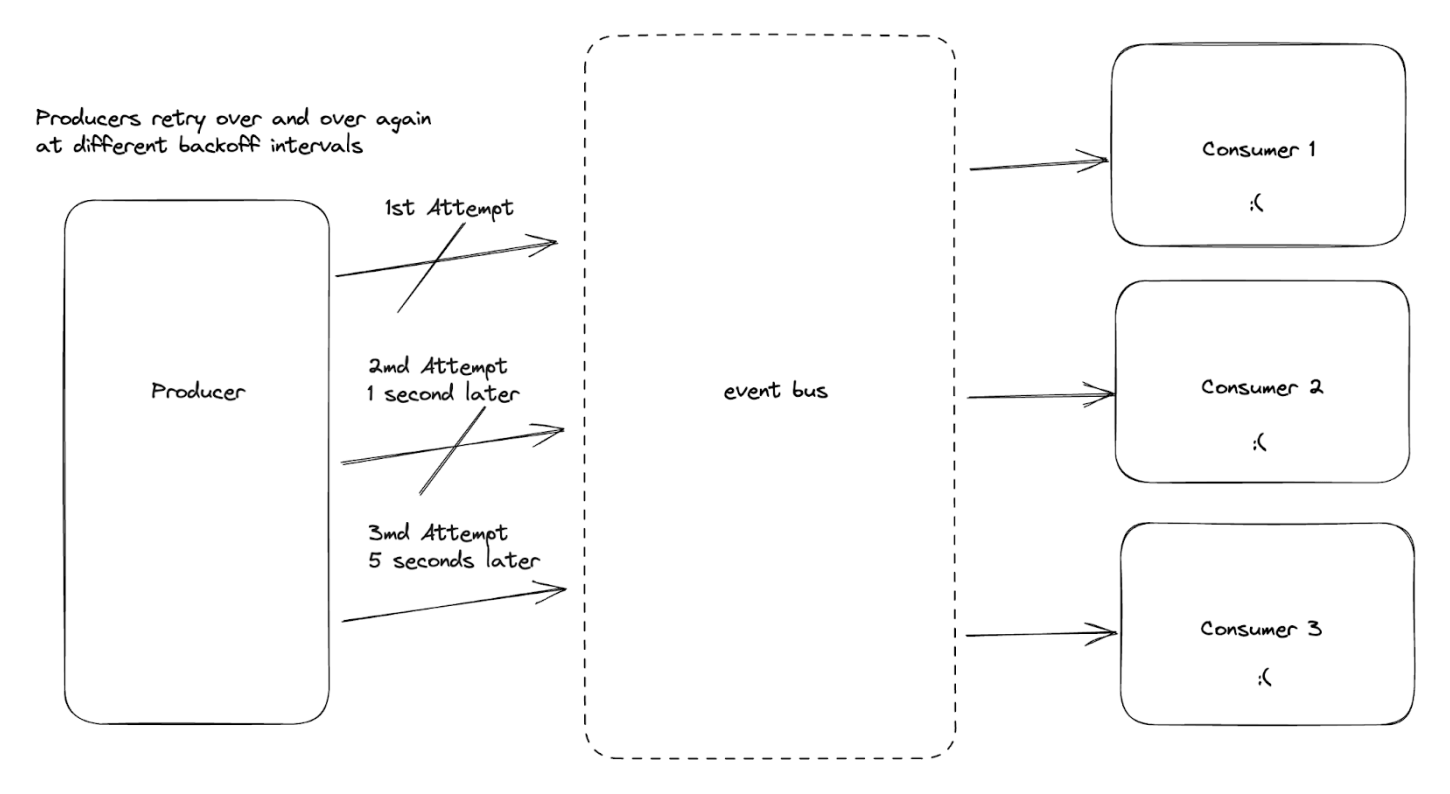
Backoff Retries
Sometimes in life, waiting a little bit of time and trying again is a perfectly acceptable strategy. Technology patterns often mimic real-life, and this is no exception - having your producers implement exponential back-off policies can be a good way to bake in resiliency to your system in the event that event routers go down.
Message Contracts Changing
When developing event-driven systems, there is an implicit coupling between your event producers and your event consumers.
Over time, the number of producers and consumers naturally grows, and with it, so too does the size of impact if the contract between these producers and consumers does break.
So, the million dollar (or potentially more depending on the size of company you work at) is: "How can you guard against message contracts changing?"
Additive only updates
Once a field has been published, you must always assume that no matter what, there is a chance that some downstream consumer is now dependent on that particular field in order to function.
Over time, you might find your schema grows to massage message sizes, and you might want to tidy up some of the fields, but you will need to take the utmost care, and ensure that every consumer has been updated to no longer be dependent on these fields prior to their removal.
The removal of fields should very much be the exception rather than the norm.
Avoid behavioural changes on existing fields
You might find yourself needing to make changes to how particular fields are populated in your schema. For example, you might want to change your event_name field to have a value of new_subscriber as opposed to subscriber_onboarded.
This might be a change that potentially helps to standardise all event names for all the events published to your event router.
However, here be dragons!
Much like consumer's reliance on fields being present, you can also assume that they are reliant on specific values being present within code. A simple capitalisation or typo can see your event consumers grind to a halt.
Mitigation?
Effectively, the best way to mitigate this is by absolutely nailing how you manage the contracts between these services.
Truth-be-told, I'm a fan of using mono-repos with strictly enforced change management principles and review procedures to help prevent the most egregious of preventable errors from going live.
Having lower-level fully functioning QA or Dev environments where you can run suites of tests against these changes prior to them going into production is ideal.
Dead Letter Queues
The final pattern we're going to look at is the use of dead letter queues in your event driven architecture.
To use a real-world analogy, let's imagine that someone attempts to send a postcard to their grandma whilst they are soaking up the sun in the Faroe Islands. Perhaps they mistakenly put an address that doesn't map to a physical address that the automated postal systems can handle.
In this situation, the postcard would typically be put in a manual-sorting bucket of other mail that also cannot be routed by the postal system and subsequently, a post-office worker will then be tasked with manually going through all of these and figuring out the correct addresses.
This analogy directly maps onto the digital world. There will ultimately be instances in your system where the post-card-esque events cannot be consumed off the original topic on your event bus by any of the consumers running.
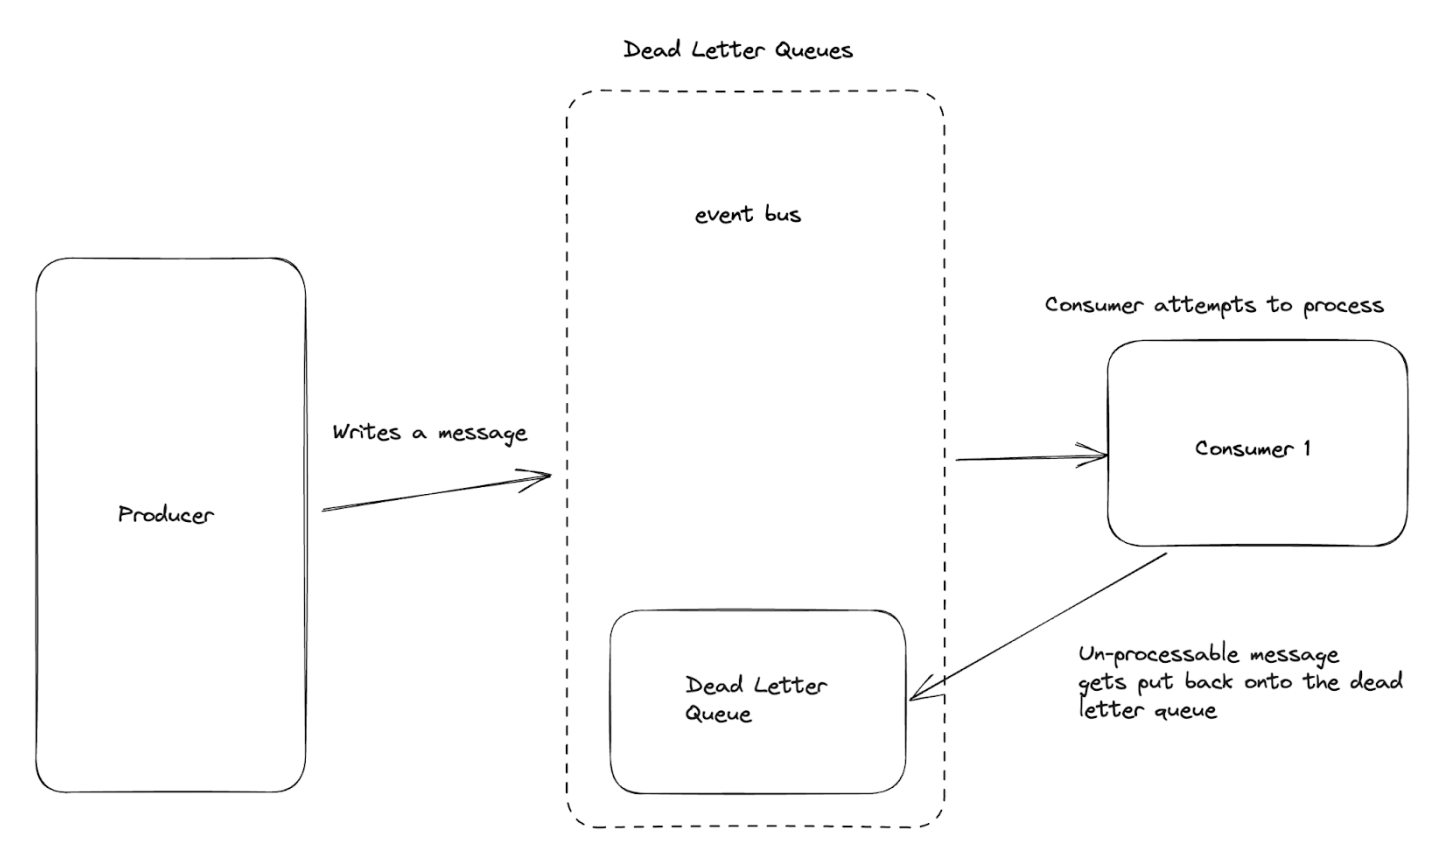
In this situation, we then would typically send something like a Failed to Receive response back and ultimately that event would end up in event bus hypothetical manual sorting bin.
This is an incredibly powerful pattern if you work with systems that need to provide certain guarantees to customers, such as in the payment world. If an incoming event comes in and, due to a logical bug, you're unable to process it, the dead-letter exchange effectively gives you a second life and you can work through these and hopefully eventually process them.
Alert Setup
If you do follow this pattern, it's important to set up appropriate alerts on the size of your dead letter queues. Letting them grow indefinitely is a recipe for disaster and can eventually bring your event-bus down when the size of the queue surpasses the high-water mark.
It's important to find a balance that works well for your system. Some systems require that no events ever end up in the dead letter queue, whilst others might have a little bit more flexibility depending on the needs of the customer.
Regardless of your system's needs, it's important to add monitors that alert you when the size of these queues surpasses an established baseline.
Processing Dead-Letter Queue Events
In some services, it might make sense to add consumers for your dead-letter queues that could perform different actions with these failed messages.
A good example of this is, say you had a system which sent support queries off to specific sub-teams of the support department. One team handled billing issues, another team handled authentication issues and so on.
Perhaps one of these queries could not be processed successfully and sent on to the appropriate sub-team and subsequently ended up on the dead-letter queue.
In this scenario, you certainly don't want to let your customers down, so it may be prudent to send this to all the sub-teams so that they can then decide who the most appropriate team is.
This is one such example of how consuming from your dead-letter queues might be beneficial, but there are certainly others and it's worthwhile keeping this option open when designing your own systems.
Wrapping Up
Let's wrap up some of the concepts we've covered in this post. Hopefully, this has made you consider how your event-driven systems can degrade and/or fail entirely and consequently has helped you consider how you can best mitigate against such issues.
Things ultimately do go wrong, unless you have an infinitely large budget, or an infinite amount of people monitoring and taking care of your system with an infinite number of redundant nodes, you will experience such failures.
The best way to spend your time is to ensure you have the appropriate monitoring and alerting in place to enable you to catch when things start to go bad, and give yourself time to start remediating any underlying issues.
Related reading
This is the third part in our four part series on Event-Driven Architecture (EDA). See also:
- Part one: What is an EDA and Why do I need One?
- Part two: Making a Business Case for an EDA
- Part four: Long Term Ownership of an EDA
About the Author
Elliot Forbes is the creator of TutorialEdge.net - one of the most comprehensive learning platforms online for learning Go.
He started his career at JPMorgan Chase building out the largest CloudFoundry estate in the world, before moving on to the high-growth startup Curve and then to CircleCI.
He is active on Twitter where he posts a variety of programming and photography content.
More Articles


