 André Eriksson
Everything's on fire. That much is clear. But what's the root cause? Nobody's got a clue.
When we build distributed systems we're used to fumbling in the dark, desperately searching for the problem. Sometimes it's due to not having enough data. But paradoxically it's often due to having too much data.
The real challenge lies in making sense of it all. Unfortunately, general-purpose observability tools often have no idea how your application works. The end result is that distributed tracing, an incredibly powerful idea, largely under-delivers and is mostly useful for tracking down performance issues. That's good, but it could be so much better.
How tracing (normally) works
Tracing builds on a few pretty simple concepts.
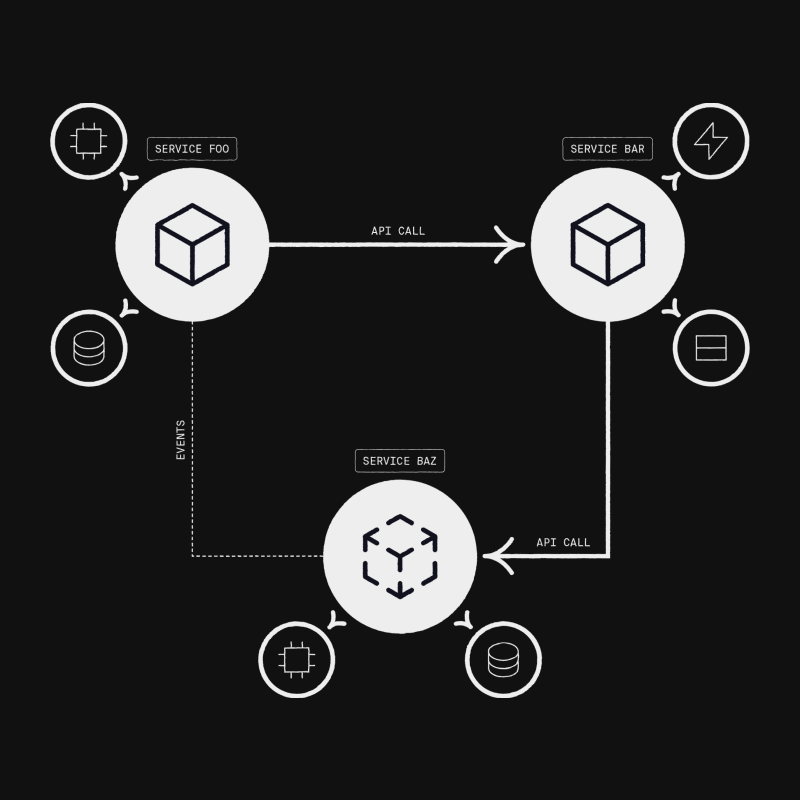
Spans are the operations we track, with a start and an end, and references between them. They're things like a running request, or a database query. Spans can reference each other, for example to communicate that one request made an API call which results in another request. In this way we can build up a tree (or in practice a directed acyclic graph, a "DAG") of all spans.
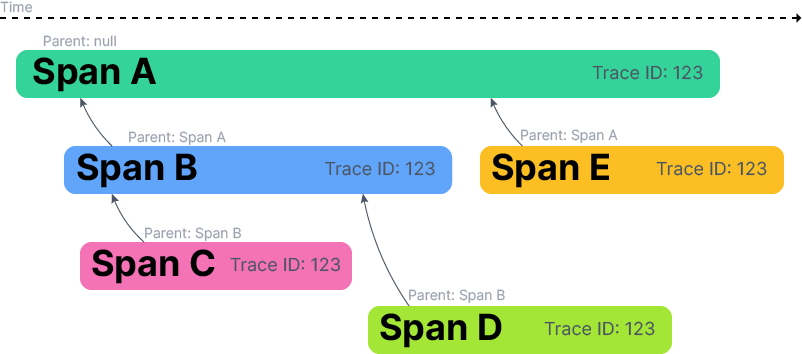
Each span contains tags, which are key-value pairs, and events which are timestamped things that happened within the span, such as emitting log messages.
Not too bad so far, right? The devil's in the details. Because this data model is so generic, it's difficult to make sense of exactly what a span represents. Is it an API call? Is it a database query? They don't know, so in practice they render everything as one long list of spans. Not too helpful.
The other challenge is in the instrumentation itself. In order to build up this DAG of spans, we need to pass along IDs to tie everything together. This data must be carefully threaded through our whole application. How to do that in practice differs from language to language, but setting it all up is quite a nuisance and if you miss some place you'll silently get lower quality data.
In practice it ends up being lots of error-prone, boilerplate-y code. And the end result is less useful than we would like. So we figured, since Encore is all about deeply understanding how your application works using static analysis, let's try to build a better distributed tracing solution that leverages that understanding. We wanted to offer much better insights, and do it in a way that works out of the box without having to do a thing. A tall order, but we believe we've succeeded.
How tracing works with Encore
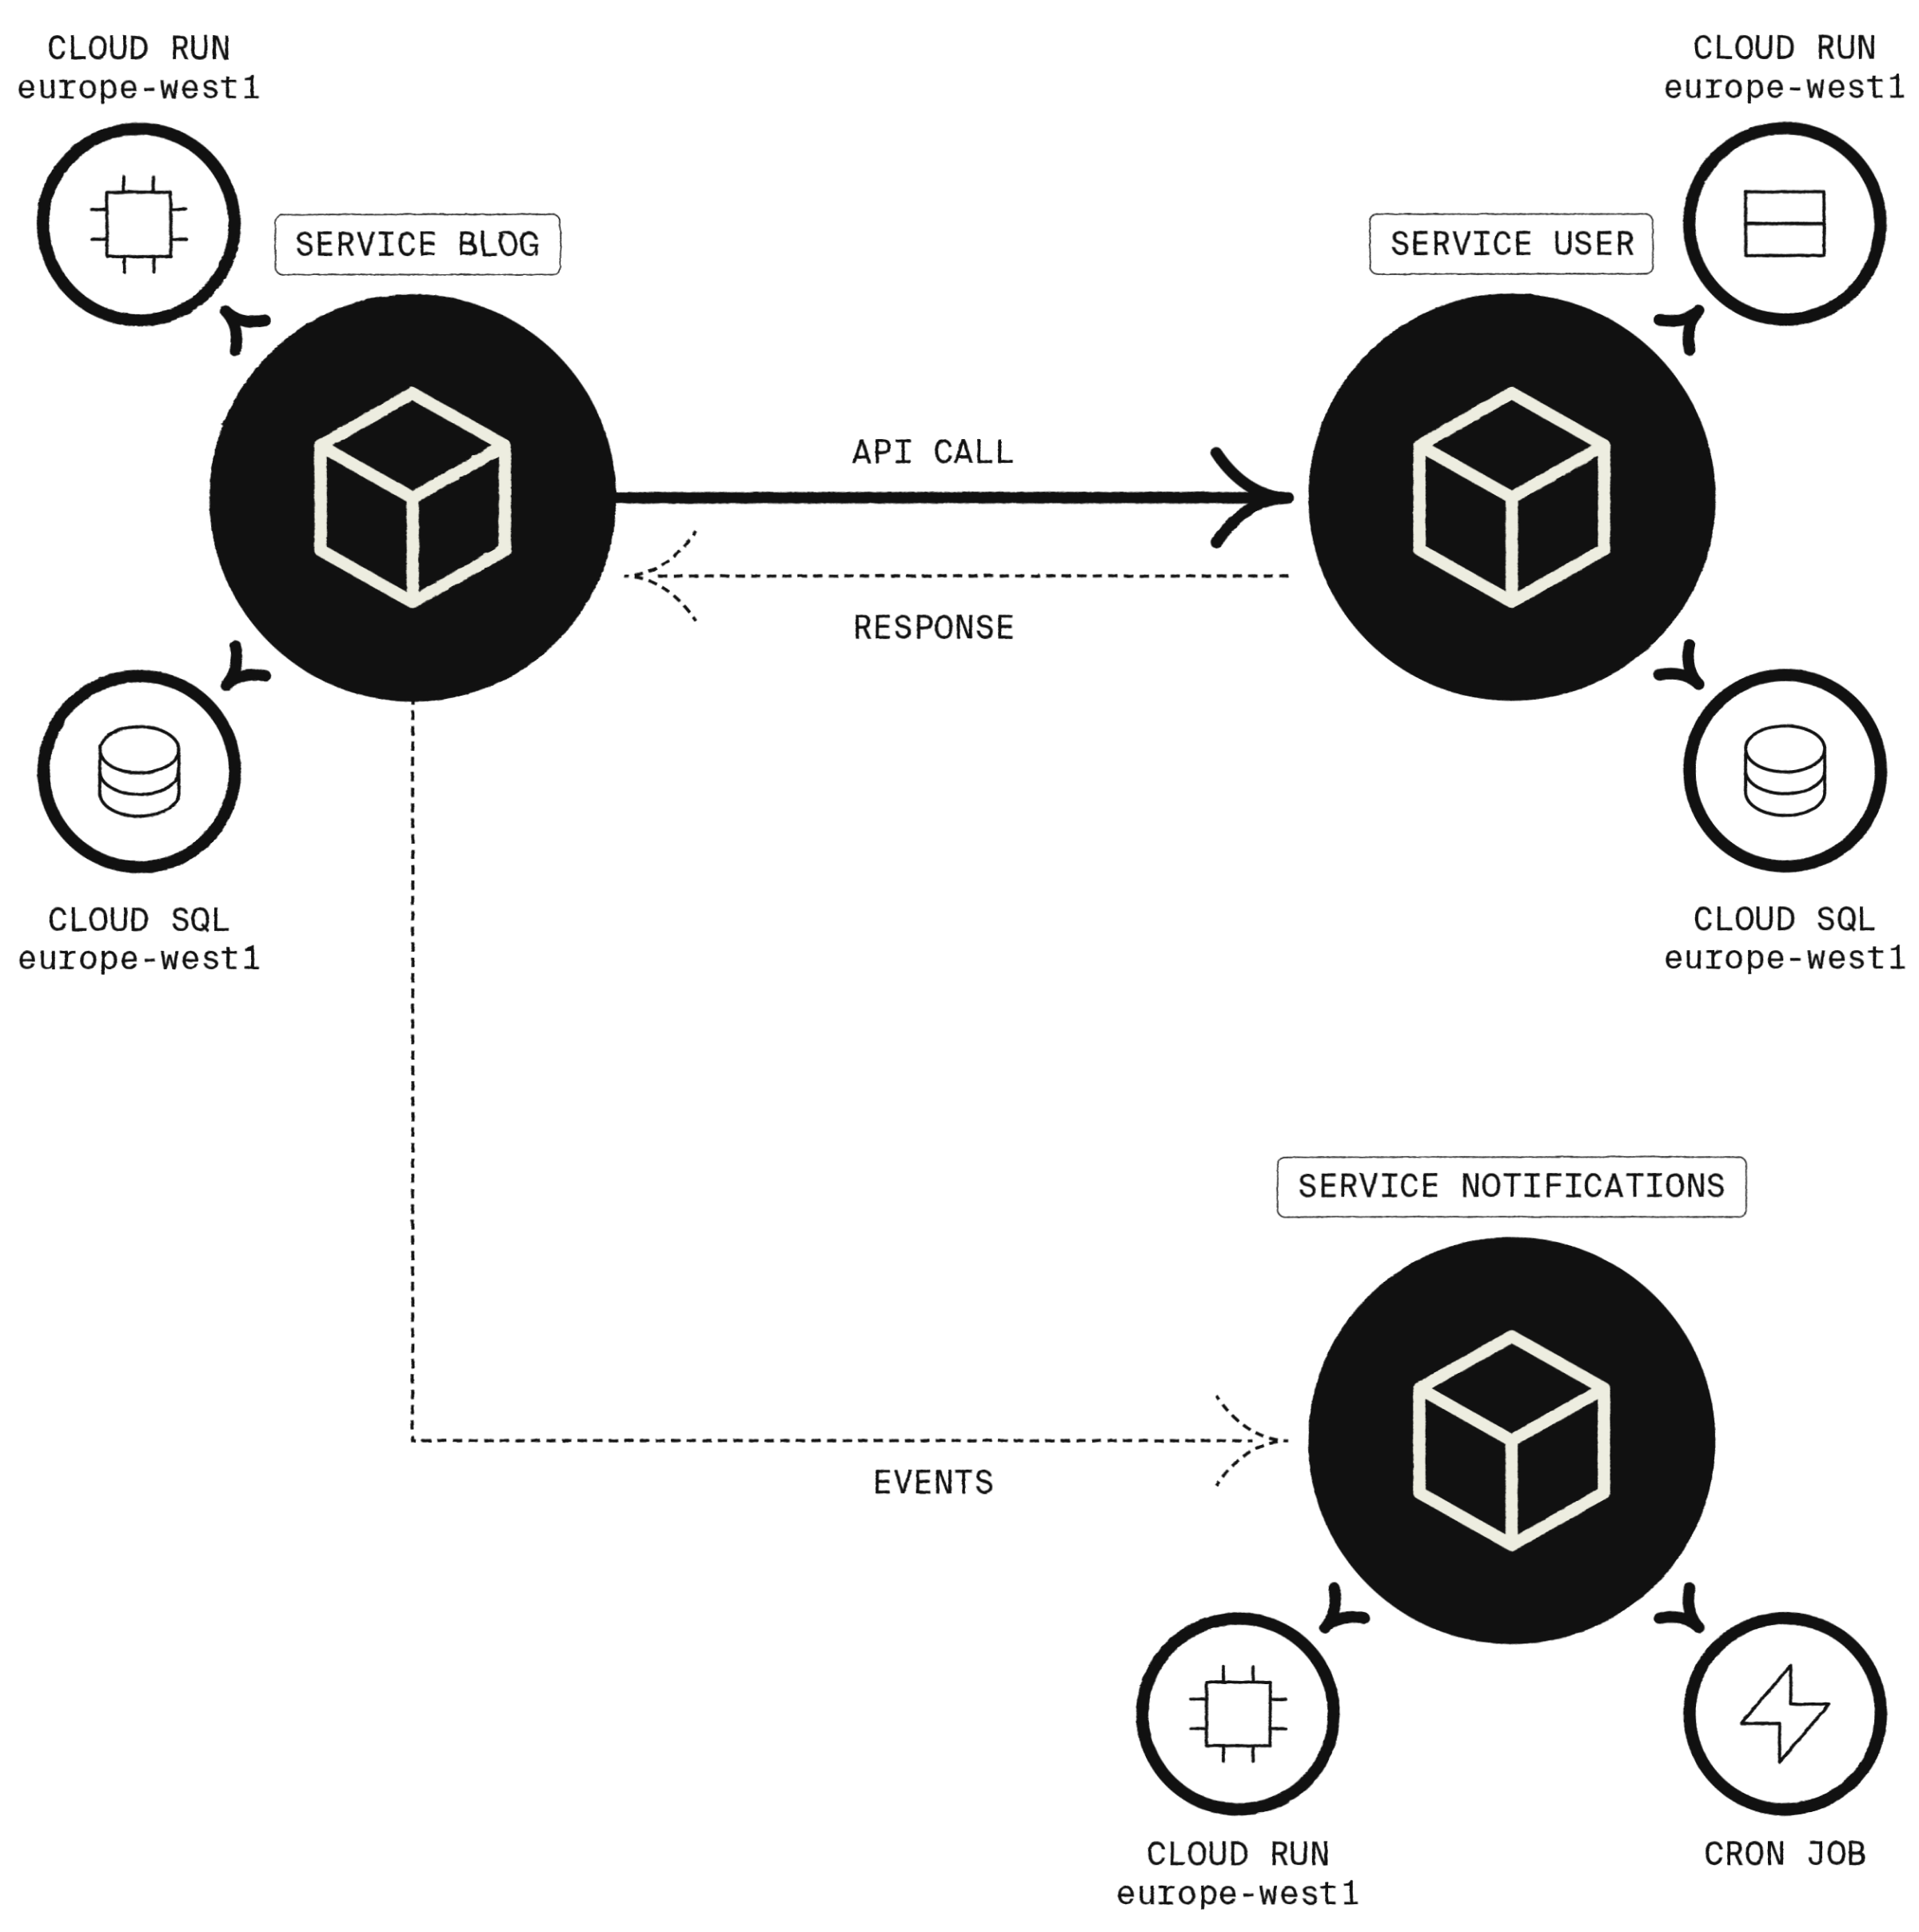
The way you write Encore applications has been carefully designed to facilitate static analysis. When you do, Encore can easily understand, among other things:
- The services and APIs you have defined, and their precise request/response schemas
- Precisely when and where you make an API call to another service, output structured log messages, execute database queries, and more
- What infrastructure each service requires to run
- Your database(s) schemas
- And lots more
Using nothing but static code analysis we build up a detailed graph of your application as a distributed system.
So now, when Encore compiles your application, it queries this graph to automatically add instrumentation in the right places. Instead of having to manually propagate trace IDs, Encore comes with a slightly modified Go runtime that automatically propagates trace information for you. And since it understands exactly what every operation is, and not just a generic "span", Encore can add incredibly rich information that is unique to each type of event. Among other things:
- Database queries, transactions, commits/rollbacks
- API calls, complete with input/output data
- Outgoing HTTP requests, along with precise timings for things like DNS resolution, TLS handshakes, and more
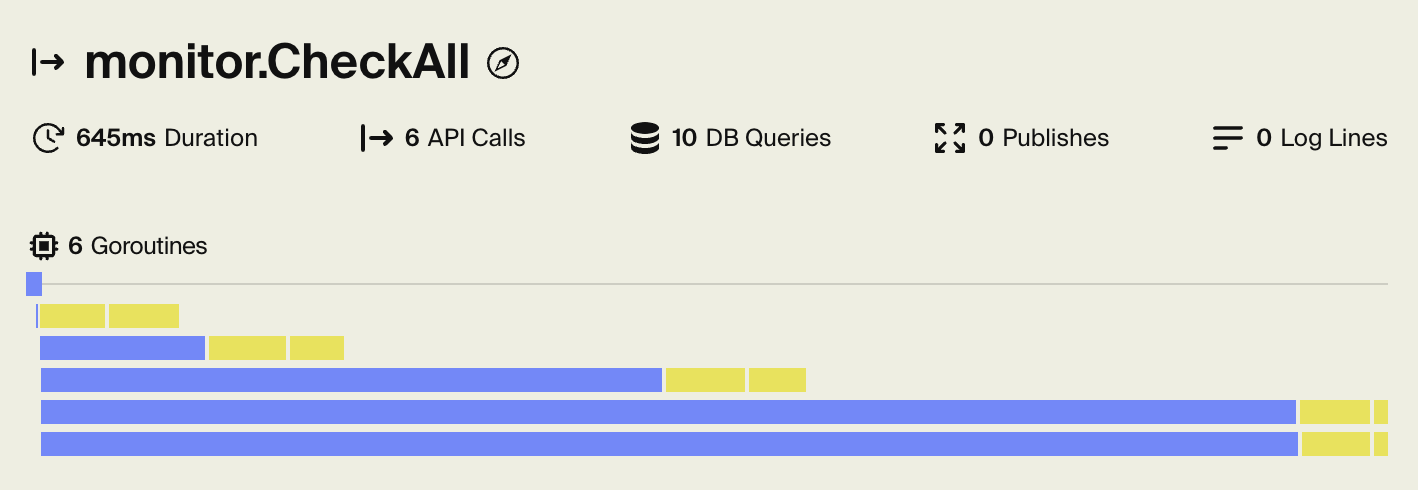
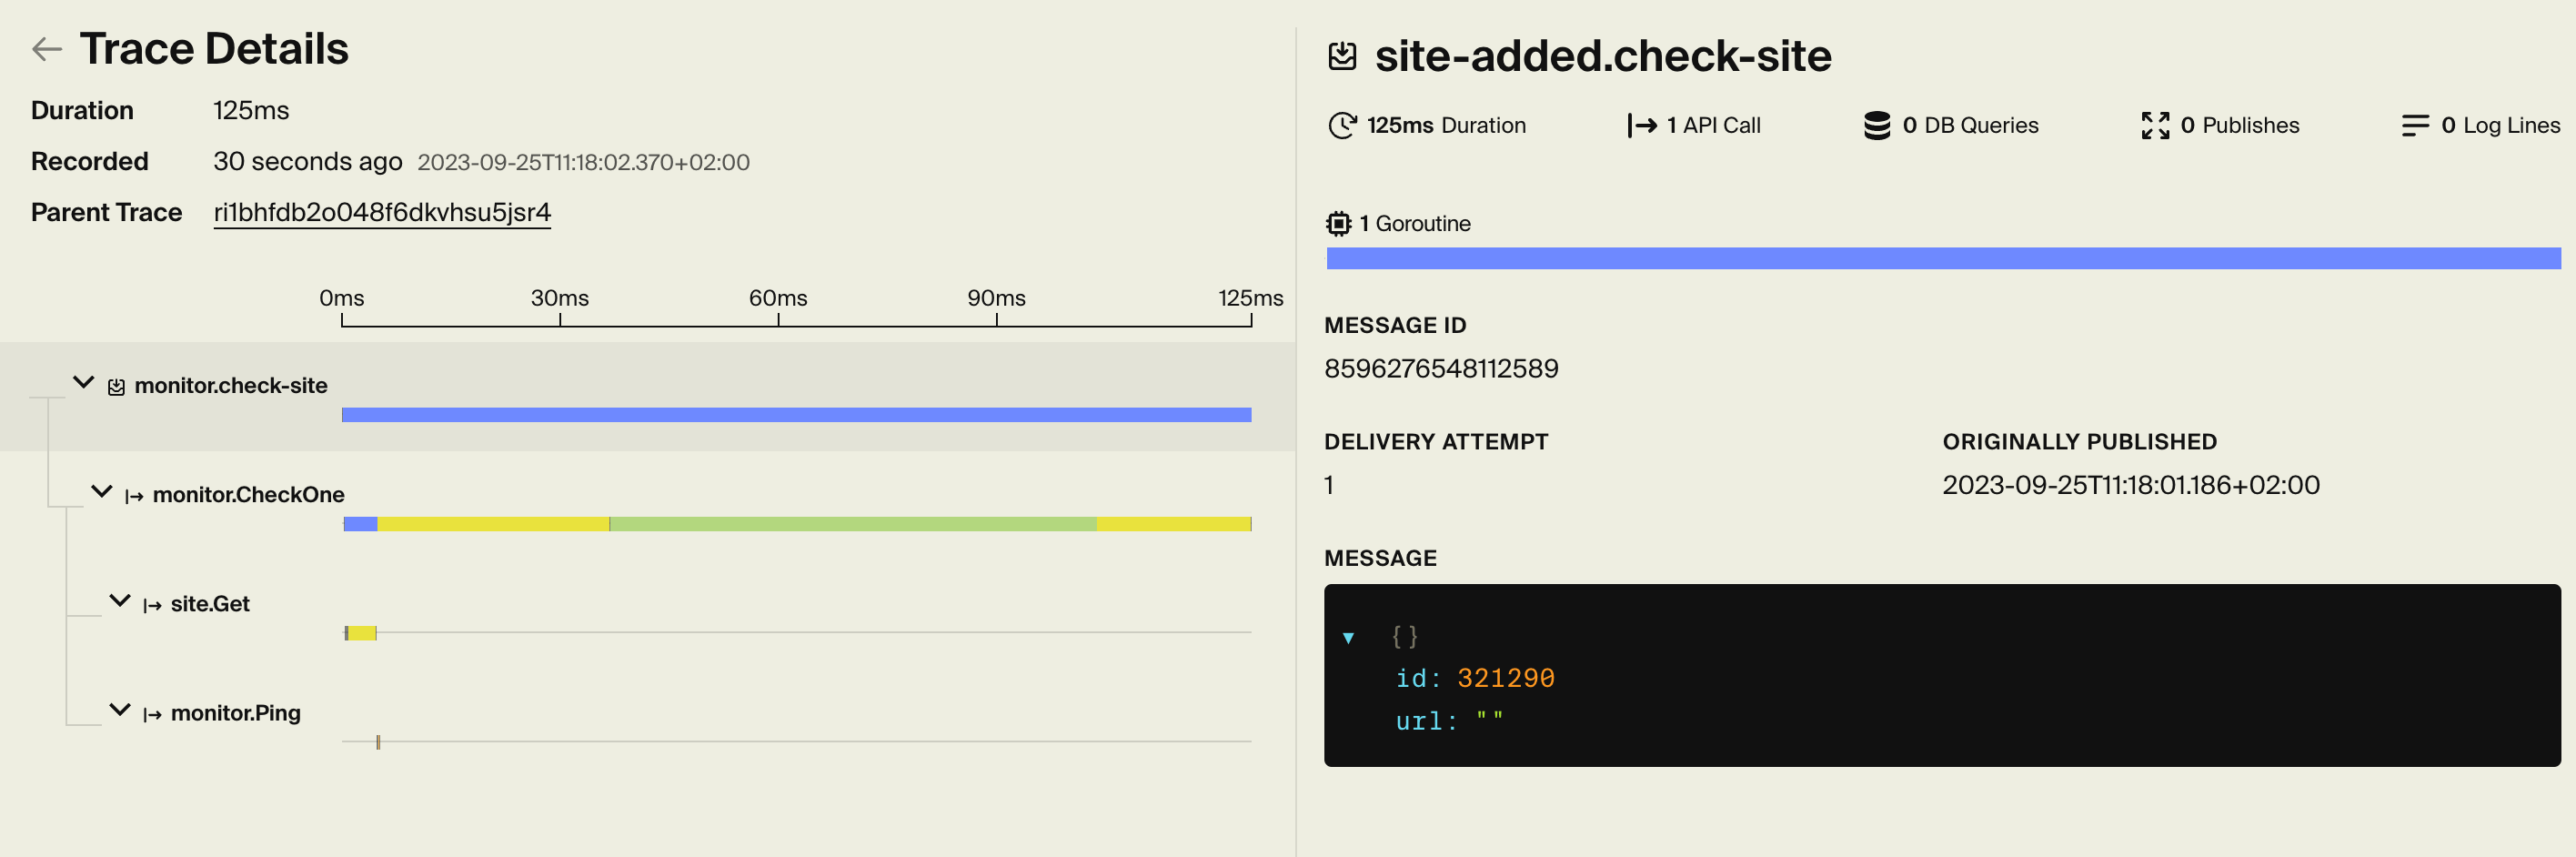
We also break things down further. Encore captures goroutine timings, allowing you to see at a glance when an API call runs multiple things in parallel. Including exactly what each goroutine did: database queries, API calls, log messages, and more.
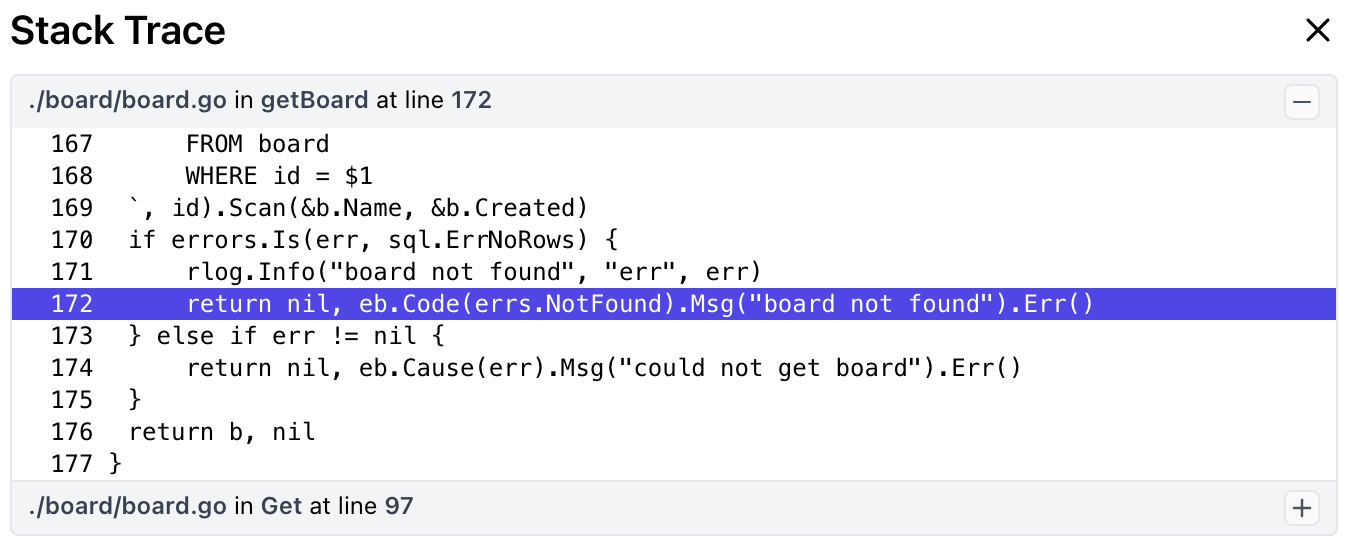
Stack traces
Finally, Encore now captures complete stack traces for everything. But wait, I hear you say, won't that be incredibly slow? Nope.
Encore only collects the program counter for each stack frame, and then uses delta encoding and varint encoding. Then when it comes to viewing a trace, we map the program counters back to the files, lines, and function names using the program's symbol table stored in the binary, that we conveniently kept around from when we did our original static analysis pass.
The end result is collecting a stack trace in as little as 300ns, and each stack frame often takes 1-2 bytes to encode. This remarkable result is only possible by the tight integration between Encore and the Go runtime. It's fast enough that we can capture stack traces for pretty much everything. Database queries, API calls, log messages, and more.
Making sense of it all
Encore is all about enabling simplicity through understanding your application, and we wanted the tracing experience to reflect that. So instead of doing all this instrumentation by hand, and presenting a trace as a long list of spans, we wanted it to "just work" with no additional effort on your part, and with a UI that reflects the structure of your app.
Stack traces are great and all, but when you're building a distributed system they're often insufficient to get a complete picture of what's going on. That's what's so beautiful about our approach: the stack traces are themselves embedded in the distributed trace data.
In the end, the traces are much richer in information and at the same time faster to collect. And by understanding exactly what each span represents, we can visualize traces in a much more understandable way. And the stack traces we capture? We can correlate them across the whole system, so you can understand the exact code path across all your services that led to a particular event.
Tracing Everywhere
The final piece of the puzzle was the realization that such a powerful experience is useful for many more things than just performance analysis. That's why we made it available everywhere, and perhaps most critically, for local development.
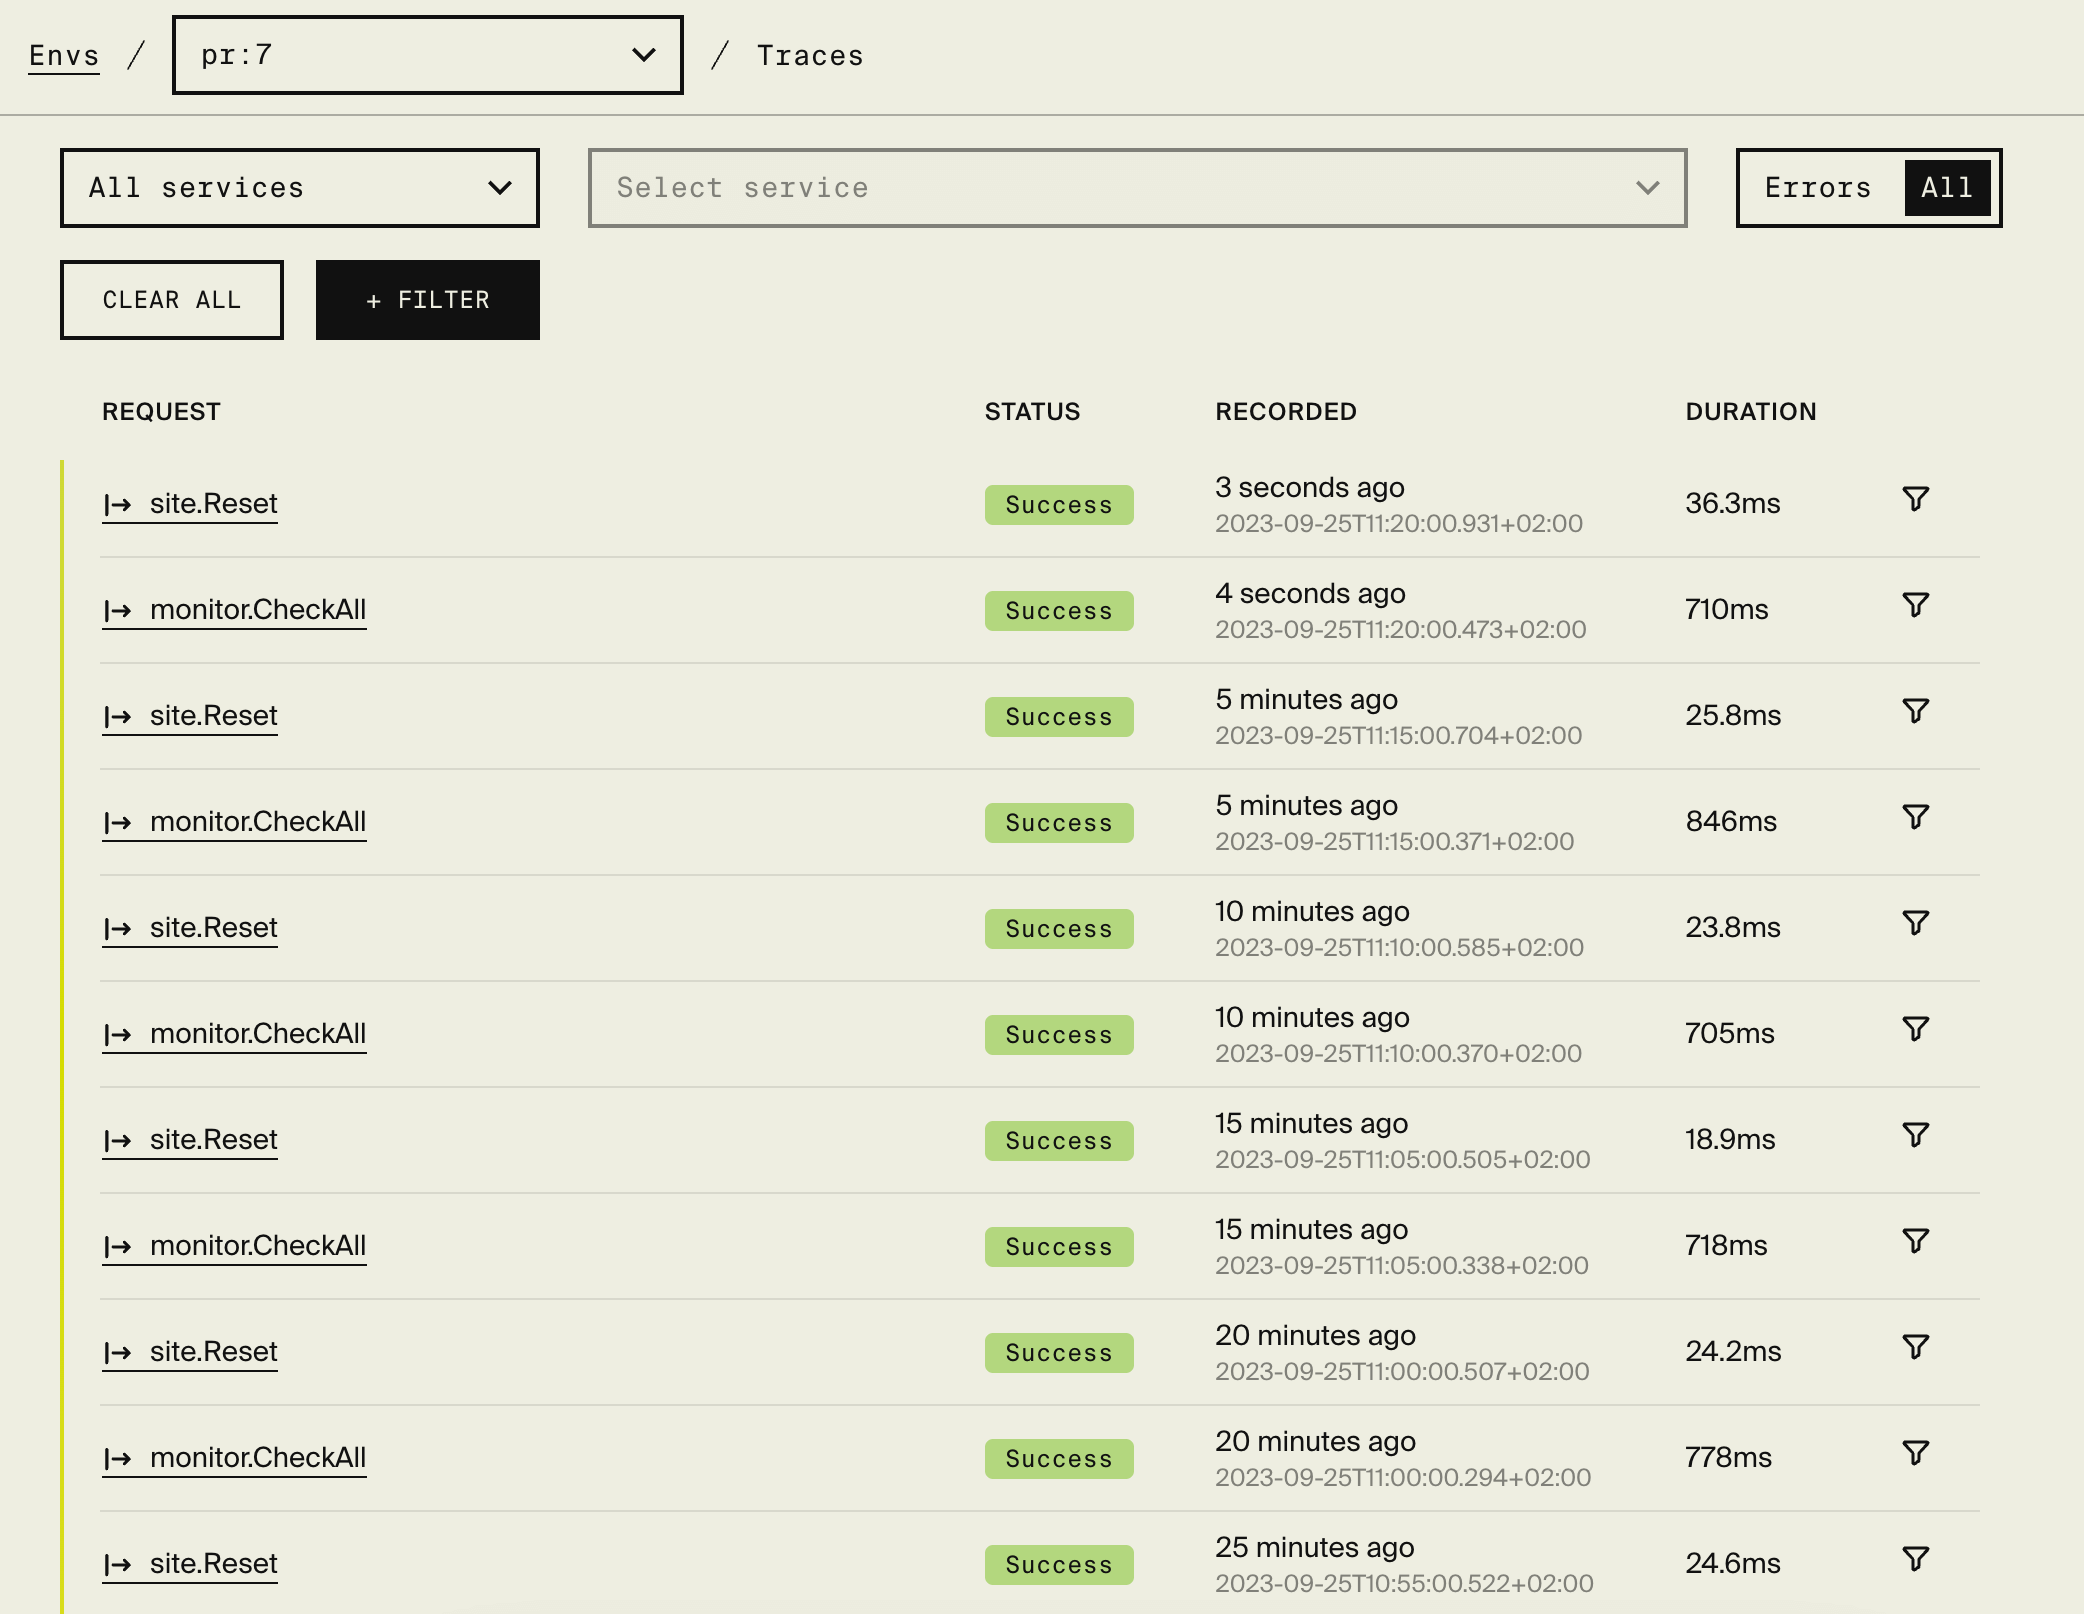
That way, the next time you're building a new feature, and you find a bug, you can immediately open up the trace view and see exactly where the problem is. Same goes for production, your test environment, and for all your Preview Environments that Encore automatically spins up for each Pull Request you open. And that time when everything was on fire and you couldn't figure out why? It sure would be nice to immediately pinpoint where the problem was.
Why, you ask? Because it's about time we developers got better tools.
Related Articles

 Ivan Cernja
 Ivan Cernja
 Ivan Cernja