# Metrics
> Built-in support for keeping track of key metrics
Having easy access to key metrics is a critical part of application observability.
Encore solves this by providing automatic dashboards of common application-level
metrics for each service.
Encore also makes it easy to define custom metrics for your application. Once defined, custom metrics are automatically displayed on metrics page in the Cloud Dashboard.
By default, Encore also exports metrics data to your cloud provider's built-in monitoring service.
## Defining custom metrics
Encore makes it easy to define custom metrics for your application. Once defined, custom metrics are automatically displayed on the metrics page in the Cloud Dashboard.
For implementation guides on how to define metrics in your code, see:
- [Go metrics documentation](/docs/go/observability/metrics)
- [TypeScript metrics documentation](/docs/ts/observability/metrics)
## Integrations with third party observability services
To make it easy to use a third party service for monitoring, we're adding direct integrations between Encore and popular observability services. This means you can send your metrics directly to these third party services instead of your cloud provider's monitoring service.
### Grafana Cloud
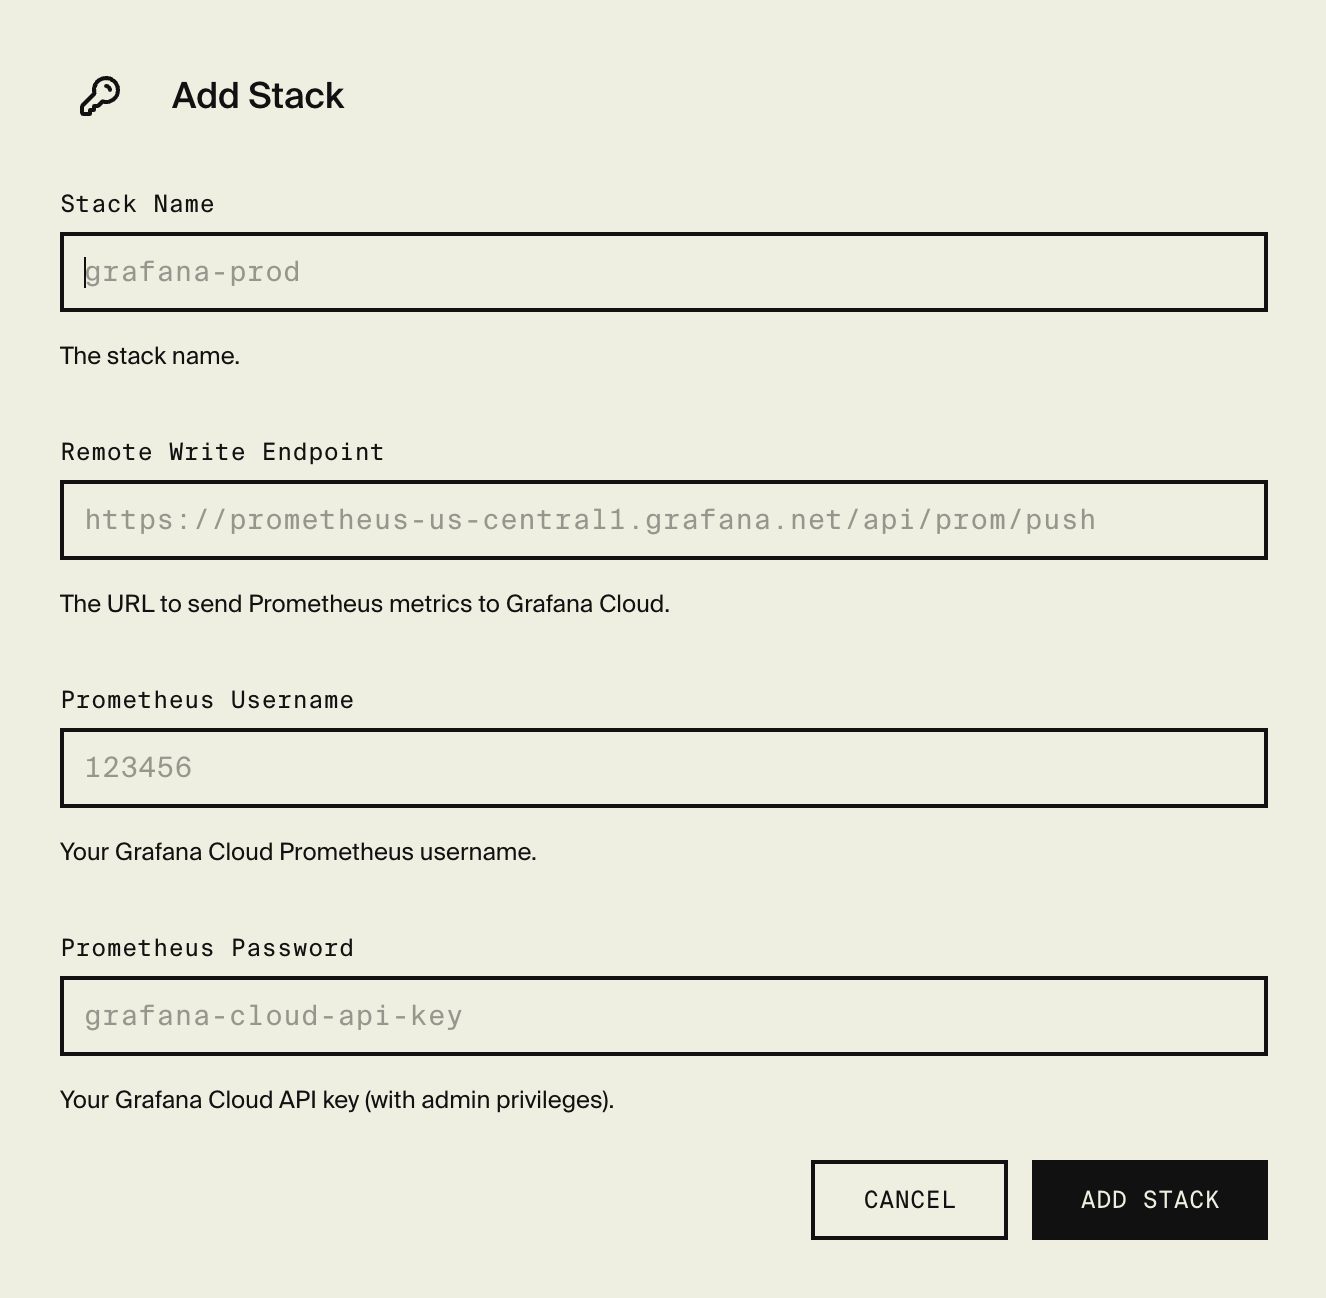
To send metrics data to Grafana Cloud, you first need to Add a Grafana Cloud Stack to your application.
Open your application in the [Encore Cloud dashboard](https://app.encore.cloud), and click on **Settings** in the main navigation.
Then select **Grafana Cloud** in the settings menu and click on **Add Stack**.
Next, open the environment **Overview** for the environment you wish to sent metrics from and click on **Settings**.
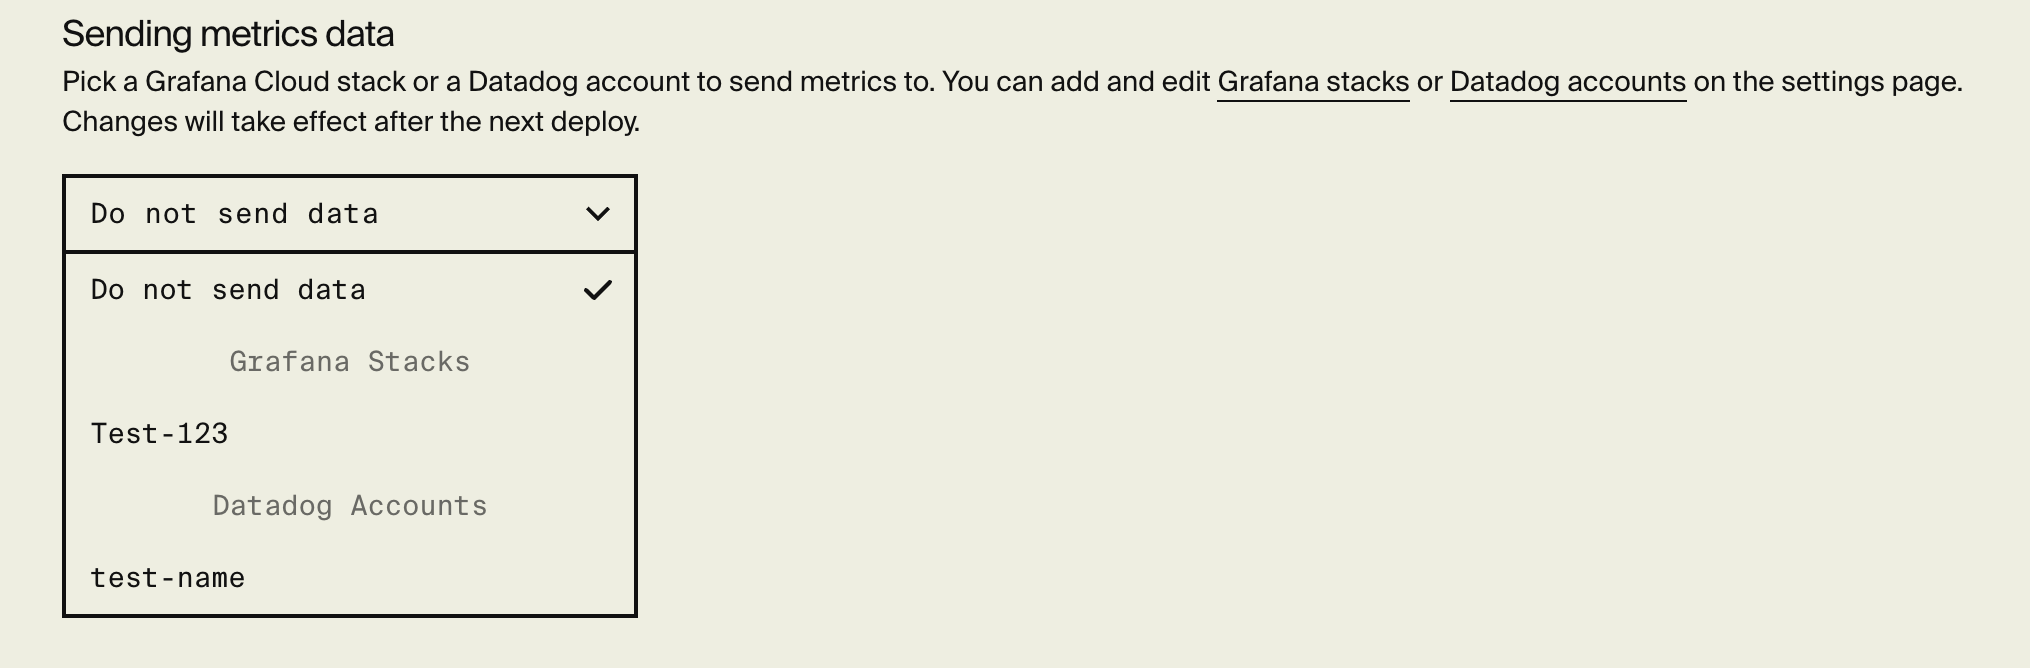
Then in the **Sending metrics data** section, select your Grafana Cloud Stack from the drop-down and save.
That's it! After your next deploy, Encore will start sending metrics data to your Grafana Cloud Stack.
To configure Encore to export metrics to Grafana Cloud, create a token with the following steps:
1. In Grafana, navigate to **Administration > Users and access > Cloud access policies**
2. Click **Create access policy**, select **metrics:read** and **metrics:write** scopes, then click **Create**
3. On the newly created access policy, click **Add token**, then **Create** to generate the token
### Datadog
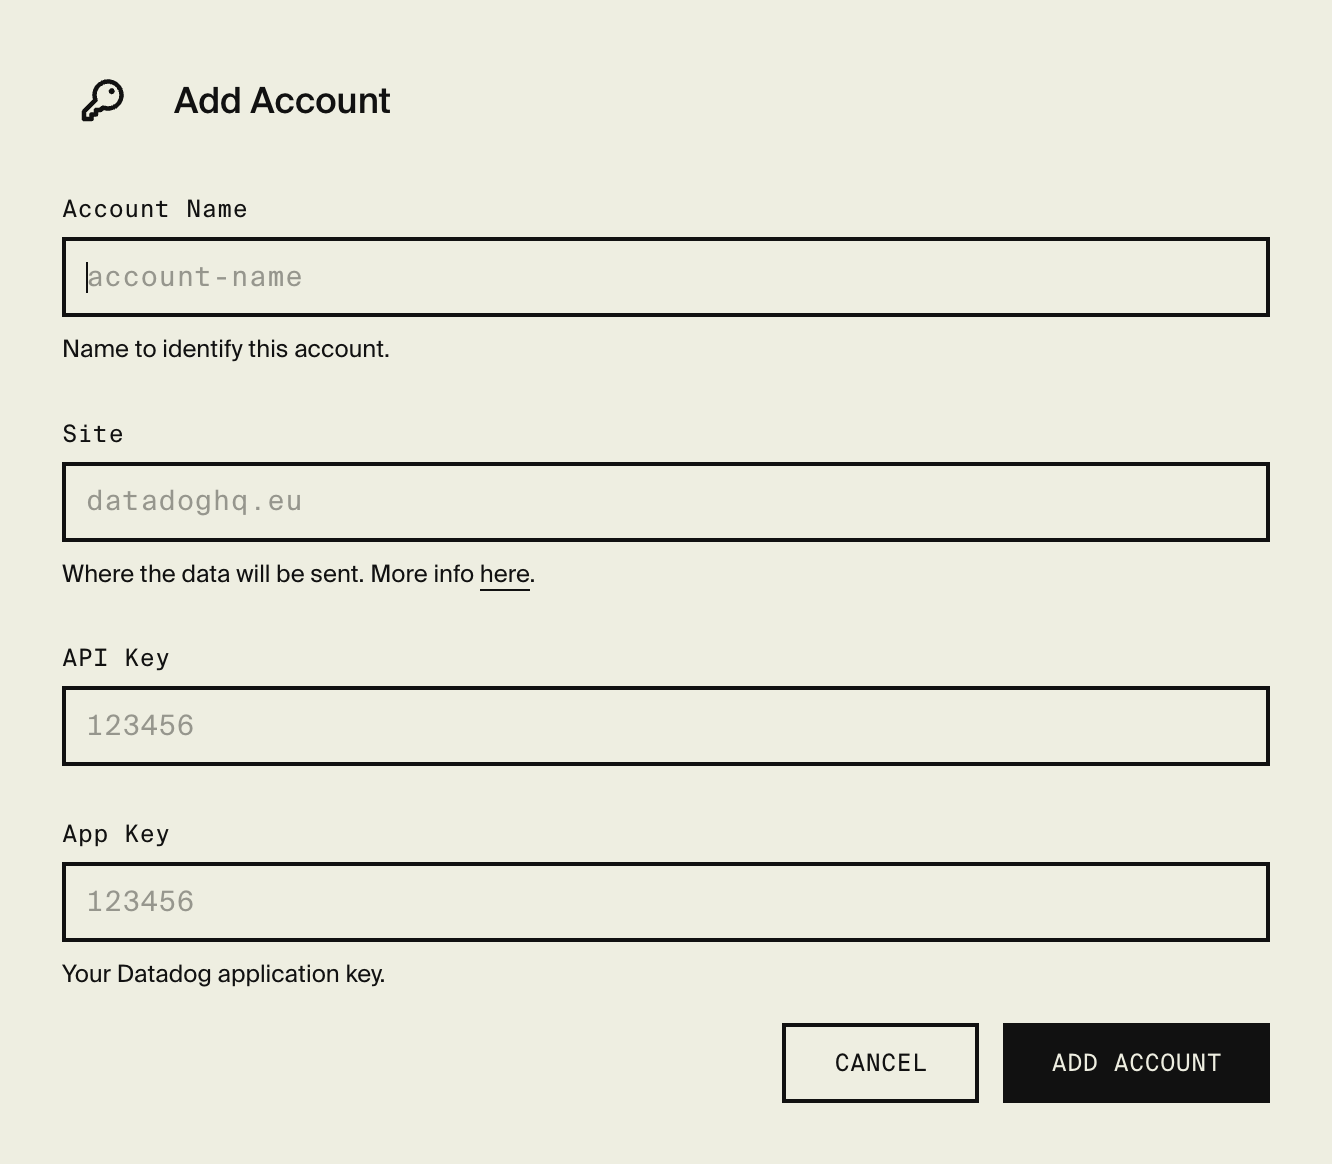
To send metrics data to Datadog, you first need to add a Datadog Account to your application.
Open your application in the [Encore Cloud dashboard](https://app.encore.cloud), and click on **Settings** in the main navigation.
Then select **Datadog** in the settings menu and click on **Add Account**.
Next, open the environment **Overview** for the environment you wish to sent metrics from and click on **Settings**.
Then in the **Sending metrics data** section, select your Datadog Account from the drop-down and save.
That's it! After your next deploy, Encore will start sending metrics data to your Datadog Account.
 Next, open the environment **Overview** for the environment you wish to sent metrics from and click on **Settings**.
Then in the **Sending metrics data** section, select your Grafana Cloud Stack from the drop-down and save.
Next, open the environment **Overview** for the environment you wish to sent metrics from and click on **Settings**.
Then in the **Sending metrics data** section, select your Grafana Cloud Stack from the drop-down and save.
 That's it! After your next deploy, Encore will start sending metrics data to your Grafana Cloud Stack.
 Next, open the environment **Overview** for the environment you wish to sent metrics from and click on **Settings**.
Then in the **Sending metrics data** section, select your Datadog Account from the drop-down and save.
Next, open the environment **Overview** for the environment you wish to sent metrics from and click on **Settings**.
Then in the **Sending metrics data** section, select your Datadog Account from the drop-down and save.