Building an Uptime Monitor
Learn how to build an event-driven uptime monitoring system
Want to be notified when your website goes down so you can fix it before your users notice?
You need an uptime monitoring system. Sounds daunting? Don't worry, we'll build it with Encore in 30 minutes!
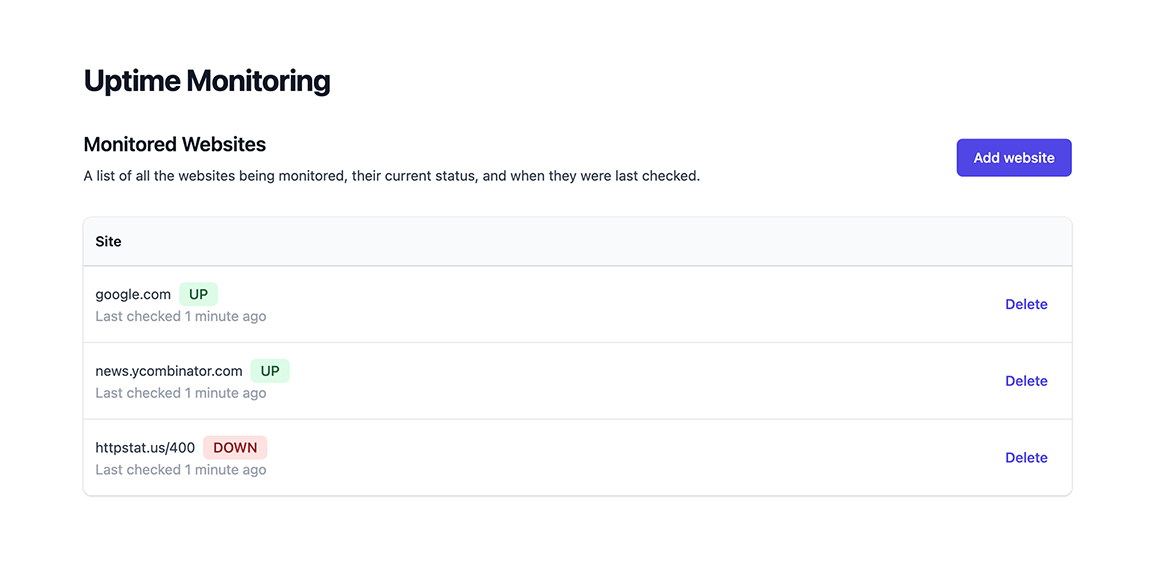
The app will use an event-driven architecture and the final result will look like this:

Project
1. Create your Encore application
Please note
To make it easier to follow along, we've laid out a trail of croissants to guide your way. Whenever you see a 🥐 it means there's something for you to do.
🥐 Create a new Encore application, using this tutorial project's starting-point branch. This gives you a ready-to-go frontend to use.
$ encore app create uptime --example=github.com/encoredev/example-app-uptime/tree/starting-point-tsIf this is the first time you're using Encore, you'll be asked if you wish to create a free account. This is needed when you want Encore to manage functionality like secrets and handle cloud deployments (which we'll use later on in the tutorial).
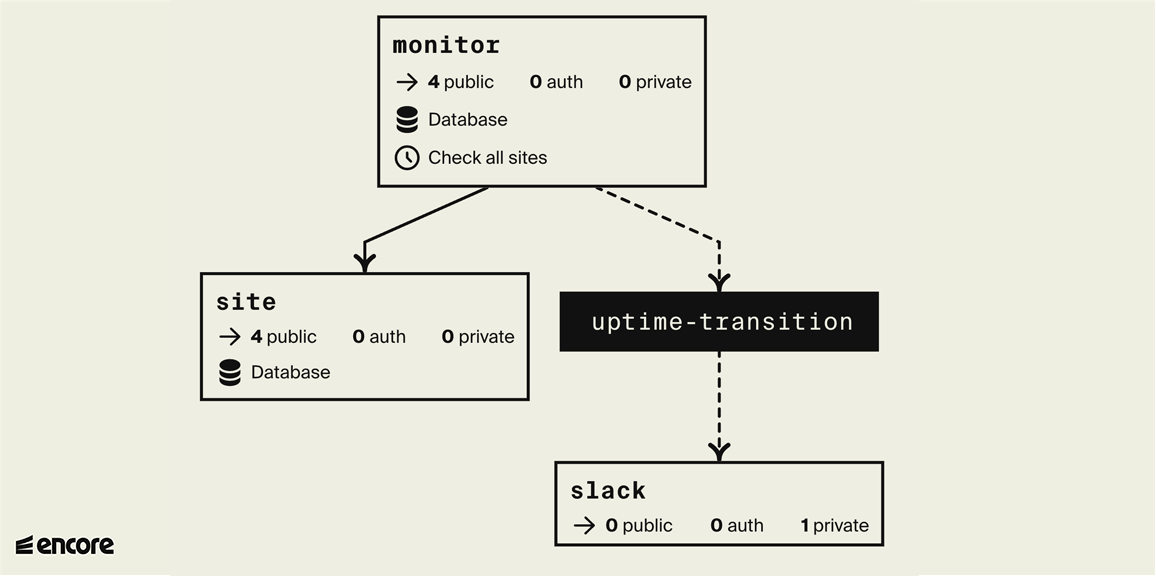
When we're done we'll have a backend with an event-driven architecture, as seen below in the automatically generated diagram where white boxes are services and black boxes are Pub/Sub topics:

2. Create monitor service
Let's start by creating the functionality to check if a website is currently up or down. Later we'll store this result in a database so we can detect when the status changes and send alerts.
🥐 Create a directory named monitor containing a file named encore.service.ts.
$ mkdir monitor$ touch monitor/encore.service.ts🥐 Add the following code to monitor/encore.service.ts:
monitor/encore.service.tsimport { Service } from "encore.dev/service";

export default new Service("monitor");
This is how you create define services with Encore. Encore will now consider files in the monitor directory and all its subdirectories as part of the monitor service.
🥐 In the monitor directory, create a file named ping.ts.
🥐 Add an Encore API endpoint named ping that takes a URL as input and returns a response
indicating whether the site is up or down.
monitor/ping.ts// Service monitor checks if a website is up or down.
import { api } from "encore.dev/api";

export interface PingParams {
  url: string;
}

export interface PingResponse {
  up: boolean;
}

// Ping pings a specific site and determines whether it's up or down right now.
export const ping = api<PingParams, PingResponse>(
  { expose: true, path: "/ping/:url", method: "GET" },
  async ({ url }) => {
    // If the url does not start with "http:" or "https:", default to "https:".
    if (!url.startsWith("http:") && !url.startsWith("https:")) {
      url = "https://" + url;
    }

    try {
      // Make an HTTP request to check if it's up.
      const resp = await fetch(url, { method: "GET" });
      // 2xx and 3xx status codes are considered up
      const up = resp.status >= 200 && resp.status < 300;
      return { up };
    } catch (err) {
      return { up: false };
    }
  }
);
🥐 Let's try it! Run encore run in your terminal and you should see the service start up.
Then open up the Local Development Dashboard at http://localhost:9400 and try calling the monitor.ping endpoint from the API Explorer, passing in google.com as the URL.
You can then see the response, logs, and view a trace of the request. It will look like this:
If you prefer to use the terminal instead run curl http://localhost:4000/ping/google.com in a new terminal instead. Either way you should see the response:
{"up": true}
You can also try with httpstat.us/400 and some-non-existing-url.com and it should respond with {"up": false}.
(It's always a good idea to test the negative case as well.)
Add a test
🥐 Let's write an automated test so we don't break this endpoint over time. Create the file monitor/ping.test.ts
with the content:
monitor/ping.test.tsimport { describe, expect, test } from "vitest";
import { ping } from "./ping";

describe("ping", () => {
  test.each([
    // Test both with and without "https://"
    { site: "google.com", expected: true },
    { site: "https://encore.dev", expected: true },

    // 4xx and 5xx should considered down.
    { site: "https://not-a-real-site.xyz", expected: false },
    // Invalid URLs should be considered down.
    { site: "invalid://scheme", expected: false },
  ])(
    `should verify that $site is ${"$expected" ? "up" : "down"}`,
    async ({ site, expected }) => {
      const resp = await ping({ url: site });
      expect(resp.up).toBe(expected);
    },
  );
});
🥐 Run encore test to check that it all works as expected. You should see something like:
$ encore testDEV v1.3.0✓ monitor/ping.test.ts (4) ✓ ping (4) ✓ should verify that 'google.com' is up ✓ should verify that 'https://encore.dev' is up ✓ should verify that 'https://not-a-real-site.xyz' is down ✓ should verify that 'invalid://scheme' is downTest Files 1 passed (1) Tests 4 passed (4) Start at 12:31:03 Duration 460ms (transform 43ms, setup 0ms, collect 59ms, tests 272ms, environment 0ms, prepare 47ms)PASS Waiting for file changes...3. Create site service
Next, we want to keep track of a list of websites to monitor.
Since most of these APIs will be simple "CRUD" (Create/Read/Update/Delete) endpoints, let's build this service using Knex.js, an ORM library that makes building CRUD endpoints really simple.
🥐 Let's start with creating a new service named site:
$ mkdir site # Create a new directory in the application root$ touch site/encore.service.tssite/encore.service.tsimport { Service } from "encore.dev/service";
export default new Service("site");
🥐 Now we want to add a SQL database to the site service. To do so, create a new directory named migrations folder inside the site folder:
$ mkdir site/migrations🥐 Add a database migration file inside that folder, named 1_create_tables.up.sql.
The file name is important (it must look something like 1_<name>.up.sql).
Add the following contents:
site/migrations/1_create_tables.up.sqlCREATE TABLE site (
    id SERIAL PRIMARY KEY,
    url TEXT NOT NULL UNIQUE
);
🥐 Next, install the Knex.js library and PostgreSQL client:
Now let's create the site service itself with our CRUD endpoints.
🥐 Create site/site.ts with the contents:
site/site.tsimport { api } from "encore.dev/api";
import { SQLDatabase } from "encore.dev/storage/sqldb";
import knex from "knex";

// Site describes a monitored site.
export interface Site {
  id: number; // ID is a unique ID for the site.
  url: string; // URL is the site's URL.
}

// AddParams are the parameters for adding a site to be monitored.
export interface AddParams {
  // URL is the URL of the site. If it doesn't contain a scheme
  // (like "http:" or "https:") it defaults to "https:".
  url: string;
}

// Add a new site to the list of monitored websites.
export const add = api(
  { expose: true, method: "POST", path: "/site" },
  async (params: AddParams): Promise<Site> => {
    const site = (await Sites().insert({ url: params.url }, "*"))[0];
    return site;
  },
);

// Get a site by id.
export const get = api(
  { expose: true, method: "GET", path: "/site/:id", auth: false },
  async ({ id }: { id: number }): Promise<Site> => {
    const site = await Sites().where("id", id).first();
    return site ?? Promise.reject(new Error("site not found"));
  },
);

// Delete a site by id.
export const del = api(
  { expose: true, method: "DELETE", path: "/site/:id" },
  async ({ id }: { id: number }): Promise<void> => {
    await Sites().where("id", id).delete();
  },
);

export interface ListResponse {
  sites: Site[]; // Sites is the list of monitored sites
}

// Lists the monitored websites.
export const list = api(
  { expose: true, method: "GET", path: "/site" },
  async (): Promise<ListResponse> => {
    const sites = await Sites().select();
    return { sites };
  },
);

// Define a database named 'site', using the database migrations
// in the "./migrations" folder. Encore automatically provisions,
// migrates, and connects to the database.
const SiteDB = new SQLDatabase("site", {
  migrations: "./migrations",
});

const orm = knex({
  client: "pg",
  connection: SiteDB.connectionString,
});

const Sites = () => orm<Site>("site");
🥐 Now make sure you have Docker installed and running, and then restart encore run to cause the site database to be created by Encore.
You can verify that the database was created by looking at your application's Flow architecture diagram in the local development dashboard at localhost:9400, and then use the Service Catalog to call the site.add endpoint:
You can also call the site.add endpoint from the terminal:
$ curl -X POST 'http://localhost:4000/site' -d '{"url": "https://encore.dev"}'{ "id": 1, "url": "https://encore.dev"}4. Record uptime checks
In order to notify when a website goes down or comes back up, we need to track the previous state it was in.
🥐 To do so, let's add a database to the monitor service as well.
Create the directory monitor/migrations and the file monitor/migrations/1_create_tables.up.sql:
monitor/migrations/1_create_tables.up.sqlCREATE TABLE checks (
    id BIGSERIAL PRIMARY KEY,
    site_id BIGINT NOT NULL,
    up BOOLEAN NOT NULL,
    checked_at TIMESTAMP WITH TIME ZONE NOT NULL
);
We'll insert a database row every time we check if a site is up.
🥐 Add a new endpoint check to the monitor service, that
takes in a Site ID, pings the site, and inserts a database row
in the checks table.
For this service we'll use Encore's SQLDatabase class instead of Knex (in order to showcase both approaches).
Add the following to monitor/check.ts:
monitor/check.tsimport { api } from "encore.dev/api";
import { SQLDatabase } from "encore.dev/storage/sqldb";
import { ping } from "./ping";
import { site } from "~encore/clients";

// Check checks a single site.
export const check = api(
  { expose: true, method: "POST", path: "/check/:siteID" },
  async (p: { siteID: number }): Promise<{ up: boolean }> => {
    const s = await site.get({ id: p.siteID });
    const { up } = await ping({ url: s.url });
    await MonitorDB.exec`
        INSERT INTO checks (site_id, up, checked_at)
        VALUES (${s.id}, ${up}, NOW())
    `;
    return { up };
  },
);

// Define a database named 'monitor', using the database migrations
// in the "./migrations" folder. Encore automatically provisions,
// migrates, and connects to the database.
export const MonitorDB = new SQLDatabase("monitor", {
  migrations: "./migrations",
});
🥐 Restart encore run to cause the monitor database to be created.
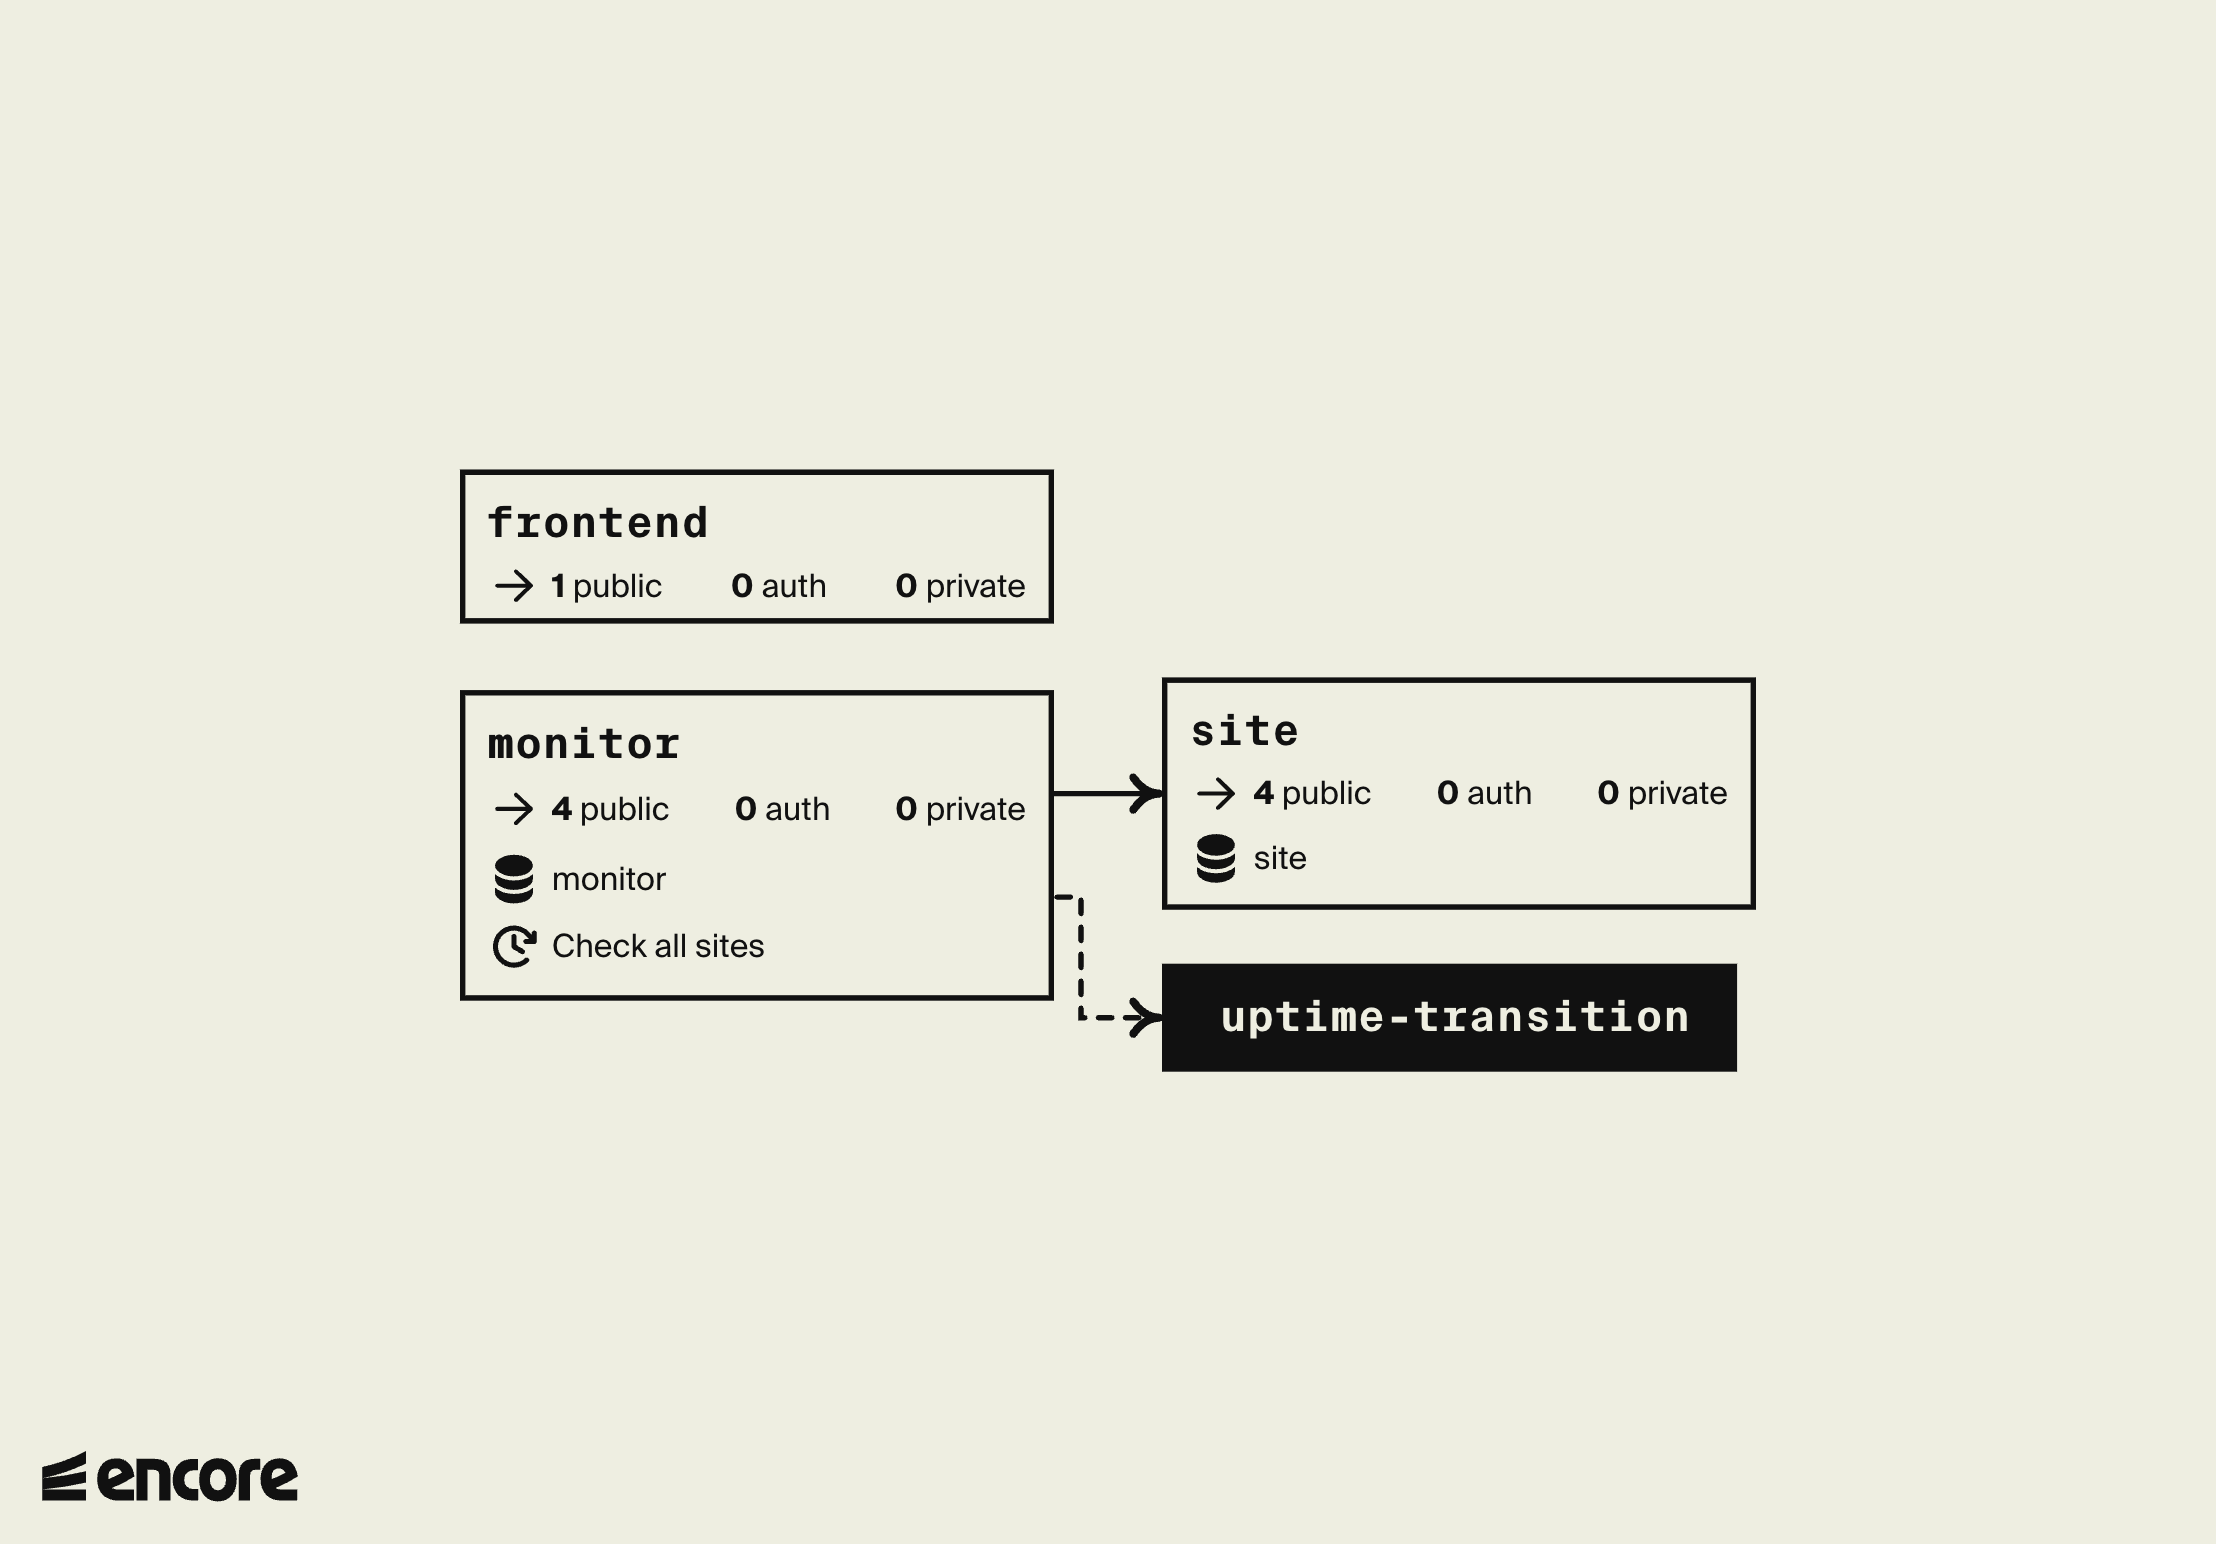
We can again verify that the database was created in the Flow diagram, and also see the dependency between the monitor service and the site service that we just added.
We can then call the monitor.check endpoint using the id 1 that we got in the last step, and view the trace where we see the database interactions.
It will look something like this:
You can also also inspect the database using encore db shell <database-name>:
If that's what you see, everything's working perfectly!
Add a cron job to check all sites
We now want to regularly check all the tracked sites so we can respond in case any of them go down.
We'll create a new checkAll API endpoint in the monitor service
that will list all the tracked sites and check all of them.
🥐 Let's extract some of the functionality we wrote for the
check endpoint into a separate function, like so:
monitor/check.tsimport {Site} from "../site/site";

// Check checks a single site.
export const check = api(
  { expose: true, method: "POST", path: "/check/:siteID" },
  async (p: { siteID: number }): Promise<{ up: boolean }> => {
    const s = await site.get({ id: p.siteID });
    return doCheck(s);
  },
);

async function doCheck(site: Site): Promise<{ up: boolean }> {
  const { up } = await ping({ url: site.url });
  await MonitorDB.exec`
      INSERT INTO checks (site_id, up, checked_at)
      VALUES (${site.id}, ${up}, NOW())
  `;
  return { up };
}
Now we're ready to create our new checkAll endpoint.
🥐 Create the new checkAll endpoint inside monitor/check.ts:
monitor/check.ts// CheckAll checks all sites.
export const checkAll = api(
  { expose: true, method: "POST", path: "/check-all" },
  async (): Promise<void> => {
    const sites = await site.list();
    await Promise.all(sites.sites.map(doCheck));
  },
);
🥐 Now that we have a checkAll endpoint, define a cron job to automatically call it every 1 hour (since this is an example, we don't need to go too crazy and check every minute):
monitor/check.tsimport { CronJob } from "encore.dev/cron";

// Check all tracked sites every 1 hour.
const cronJob = new CronJob("check-all", {
  title: "Check all sites",
  every: "1h",
  endpoint: checkAll,
});
Please note
To avoid confusion while developing, cron jobs are not triggered when running the application locally but work when deploying the application to a cloud environment.
The frontend needs a way to list all sites and display if they are up or down.
🥐 Add a file monitor/status.ts with the following code:
import { api } from "encore.dev/api";
import { MonitorDB } from "./check";

interface SiteStatus {
  id: number;
  up: boolean;
  checkedAt: string;
}

// StatusResponse is the response type from the Status endpoint.
interface StatusResponse {
  // Sites contains the current status of all sites,
  // keyed by the site ID.
  sites: SiteStatus[];
}

// status checks the current up/down status of all monitored sites.
export const status = api(
  { expose: true, path: "/status", method: "GET" },
  async (): Promise<StatusResponse> => {
    const rows = await MonitorDB.query`
      SELECT DISTINCT ON (site_id) site_id, up, checked_at
      FROM checks
      ORDER BY site_id, checked_at DESC
    `;
    const results: SiteStatus[] = [];
    for await (const row of rows) {
      results.push({
        id: row.site_id,
        up: row.up,
        checkedAt: row.checked_at,
      });
    }
    return { sites: results };
  },
);
Now that the backend is working, let's open http://localhost:4000/ in the browser to see the frontend of our application.

5. Deploy
To try out your uptime monitor for real, let's deploy it to the cloud.
Encore supports building Docker images directly from the CLI, which can then be self-hosted on your own infrastructure of choice.
If your app is using infrastructure resources, such as SQL databases, Pub/Sub, or metrics, you will need to supply a runtime configuration your Docker image.
🥐 Create a new file infra-config.json in the root of your project with the following contents:
{
   "$schema": "https://encore.dev/schemas/infra.schema.json",
   "sql_servers": [
      {
         "host": "my-db-host:5432",
         "databases": {
            "monitor": {
               "username": "my-db-owner",
                "password": {"$env": "DB_PASSWORD"}
            },
            "site": {
               "username": "my-db-owner",
                "password": {"$env": "DB_PASSWORD"}
            }
         }
      }
   ]
}
The values in this configuration are just examples, you will need to replace them with the correct values for your database. Take a look at our guide for deploying an Encore app with a PostgreSQL database to Digital Ocean for more information.
🥐 Build a Docker image by running encore build docker uptime:v1.0.
This will compile your application using the host machine and then produce a Docker image containing the compiled application.
🥐 Upload the Docker image to the cloud provider of your choice and run it.
Encore Cloud provides automated infrastructure and DevOps. Deploy to a free development environment or to your own cloud account on AWS or GCP.
Create account
Before deploying with Encore Cloud, you need to have a free Encore Cloud account and link your app to the platform. If you already have an account, you can move on to the next step.
If you don’t have an account, the simplest way to get set up is by running encore app create and selecting Y when prompted to create a new account. Once your account is set up, continue creating a new app, selecting the empty app template.
After creating the app, copy your project files into the new app directory, ensuring that you do not replace the encore.app file (this file holds a unique id which links your app to the platform).
Commit changes
Encore comes with built-in CI/CD, and the deployment process is as simple as a git push. (You can also integrate with GitHub, learn more in the CI/CD docs.)
🥐 Let's deploy your app to Encore's free development cloud by running:
$ git add -A .$ git commit -m 'Initial commit'$ git push encoreEncore will now build and test your app, provision the needed infrastructure, and deploy your application to the cloud.
After triggering the deployment, you will see a URL where you can view its progress in the Encore Cloud dashboard. It will look something like: https://app.encore.cloud/$APP_ID/deploys/...
From the Cloud Dashboard you can also see metrics, trigger Cron Jobs, see traces, and later connect your own AWS or GCP account to use for deployment.
🥐 When the deploy has finished, you can try out your uptime monitor by going to https://staging-$APP_ID.encr.app.
You now have an app running in the cloud, well done!
6. Publish Pub/Sub events when a site goes down
Hold on, an uptime monitoring system isn't very useful if it doesn't actually notify you when a site goes down.
To do so let's add a Pub/Sub topic on which we'll publish a message every time a site transitions from being up to being down, or vice versa.
🥐 Define the topic using Encore's Pub/Sub module in monitor/check.ts:
monitor/check.tsimport { Subscription, Topic } from "encore.dev/pubsub";

// TransitionEvent describes a transition of a monitored site
// from up->down or from down->up.
export interface TransitionEvent {
  site: Site; // Site is the monitored site in question.
  up: boolean; // Up specifies whether the site is now up or down (the new value).
}

// TransitionTopic is a pubsub topic with transition events for when a monitored site
// transitions from up->down or from down->up.
export const TransitionTopic = new Topic<TransitionEvent>("uptime-transition", {
  deliveryGuarantee: "at-least-once",
});
Now let's publish a message on the TransitionTopic if a site's up/down
state differs from the previous measurement.
🥐 Create a getPreviousMeasurement function to report the last up/down state:
monitor/check.ts// getPreviousMeasurement reports whether the given site was
// up or down in the previous measurement.
async function getPreviousMeasurement(siteID: number): Promise<boolean> {
  const row = await MonitorDB.queryRow`
      SELECT up
      FROM checks
      WHERE site_id = ${siteID}
      ORDER BY checked_at DESC
      LIMIT 1
  `;
  return row?.up ?? true;
}
🥐 Now add a function to conditionally publish a message if the up/down state differs by modifying the doCheck function:
monitor/check.tsasync function doCheck(site: Site): Promise<{ up: boolean }> {
  const { up } = await ping({ url: site.url });

  // Publish a Pub/Sub message if the site transitions
  // from up->down or from down->up.
  const wasUp = await getPreviousMeasurement(site.id);
  if (up !== wasUp) {
    await TransitionTopic.publish({ site, up });
  }

  await MonitorDB.exec`
      INSERT INTO checks (site_id, up, checked_at)
      VALUES (${site.id}, ${up}, NOW())
  `;
  return { up };
}
🥐 Start your app again using encore run and open the Flow architecture diagram in the local development dashboard. Now you'll see the Pub/Sub topic as a black box, it should look like this:

Now the monitoring system will publish messages on the TransitionTopic
whenever a monitored site transitions from up->down or from down->up.
It doesn't know or care who actually listens to these messages.
The truth is right now nobody does. So let's fix that by adding a Pub/Sub subscriber that posts these events to Slack.
7. Send Slack notifications when a site goes down
🥐 Start by creating a new service named slack:
$ mkdir slack # Create a new directory in the application root$ touch slack/encore.service.tsslack/encore.service.tsimport { Service } from "encore.dev/service";
export default new Service("slack");
🥐 Add a slack.ts file containing the following:
slack/slack.tsimport { api } from "encore.dev/api";
import { secret } from "encore.dev/config";
import log from "encore.dev/log";

export interface NotifyParams {
  text: string; // the slack message to send
}

// Sends a Slack message to a pre-configured channel using a
// Slack Incoming Webhook (see https://api.slack.com/messaging/webhooks).
export const notify = api<NotifyParams>({}, async ({ text }) => {
  const url = webhookURL();
  if (!url) {
    log.info("no slack webhook url defined, skipping slack notification");
    return;
  }

  const resp = await fetch(url, {
    method: "POST",
    headers: {
      'Content-Type': 'application/json',
    },
    body: JSON.stringify({ content: text }),
  });
  if (resp.status >= 400) {
    const body = await resp.text();
    throw new Error(`slack notification failed: ${resp.status}: ${body}`);
  }
});

// SlackWebhookURL defines the Slack webhook URL to send uptime notifications to.
const webhookURL = secret("SlackWebhookURL");
🥐 Now go to a Slack community of your choice where you have the permission to create a new Incoming Webhook.
🥐 Once you have the Webhook URL, set it as an Encore secret:
$ encore secret set --type dev,local,pr SlackWebhookURLEnter secret value: *****Successfully updated development secret SlackWebhookURL.🥐 Test the slack.notify endpoint by calling it via cURL:
$ curl 'http://localhost:4000/slack.notify' -d '{"text": "Testing Slack webhook"}'You should see the Testing Slack webhook message appear in the Slack channel you designated for the webhook.
🥐 When it works it's time to add a Pub/Sub subscriber to automatically notify Slack when a monitored site goes up or down. Add the following:
slack/slack.tsimport { Subscription } from "encore.dev/pubsub";
import { TransitionTopic } from "../monitor/check";

const _ = new Subscription(TransitionTopic, "slack-notification", {
  handler: async (event) => {
    const text = `*${event.site.url} is ${event.up ? "back up." : "down!"}*`;
    await notify({ text });
  },
});
8. Deploy your finished Uptime Monitor
Now you're ready to deploy your finished Uptime Monitor, complete with a Slack integration.
Because we have added more infrastructure to our app, we need to update the configuration in our infra-config.json to include the new Pub/Sub topic and subscription as well as how we should set the SlackWebhookURL secret.
🥐 Update your ìnfra-config.json to reflect the new infrastructure.
🥐 Build a Docker image by running encore build docker uptime:v2.0.
🥐 Upload the Docker image to the cloud provider and run it.
🥐 As before, deploying your app to the cloud is as simple as running:
$ git add -A .$ git commit -m 'Add slack integration'$ git push encoreCelebrate with fireworks
Now that your app is running in the cloud, let's celebrate with some fireworks:
🥐 In the Cloud Dashboard, open the Command Menu by pressing Cmd + K (Mac) or Ctrl + K (Windows/Linux).
From here you can easily access all Cloud Dashboard features and for example jump straight to specific services in the Service Catalog or view Traces for specific endpoints.
🥐 Type fireworks in the Command Menu and press enter. Sit back and enjoy the show!

Conclusion
We've now built a fully functioning uptime monitoring system.
If we may say so ourselves (and we may; it's our documentation after all) it's pretty remarkable how much we've accomplished in such little code:
- We've built three different services (
site,monitor, andslack) - We've added two databases (to the
siteandmonitorservices) for tracking monitored sites and the monitoring results - We've added a cron job for automatically checking the sites every hour
- We've set up a Pub/Sub topic to decouple the monitoring system from the Slack notifications
- We've added a Slack integration, using secrets to securely store the webhook URL, listening to a Pub/Sub subscription for up/down transition events
All of this in just a bit over 300 lines of code. It's time to lean back and take a sip of your favorite beverage, safe in the knowledge you'll never be caught unaware of a website going down suddenly.